
Introduction
Globally, wealth inequality is growing and social interaction within communities is decreasing. The effect of such disparity on social trust and relationships has been observed to increase. (Kang and Koo).
In Hong Kong, the issues of income and housing inequality are particularly pressing. Continuous growth in private rental and property prices has allowed property owners and real estate developers to gain profit, while on the other hand, leading to housing unaffordability for many lower and middle-class households, and causing rising demand for cheaper options such as public and subdivided housing. Between July 2019 and June 2020, less than 7% of more than 150,000 public housing applicants were allocated housing, of which the majority waited more than 6 years. (Arranz et al.). Furthermore, as of 2020, there are more than 110,000 subdivided units in Hong Kong. The prolonged wait time for public housing and the ubiquity of subdivided housing highlight the effects of income inequality on housing demand and affordability.
The topic of housing inequality has drawn many to study its impacts on the well-being of individuals and communities. Its impacts are important as individual and community well-being affect levels of community interaction, economic productivity, and influence social issues such as crime rate, happiness, and mental well-being. It was found that the level of trust in a community was significantly reduced when property inequality increased in China. (Dai et al.). Furthermore, in South Korea, regions with larger housing price inequality experienced lower levels of social interaction, a phenomenon especially noticeable in people from lower classes. (Kang and Koo).
Field studies were conducted in the Tertiary Planning Units 280 and 291 in Kwun Tong on March 7-8, 2024 to study
its effects in Hong Kong better. Combined with secondary research on the study area and Kwun Tong, the aim was to
identify the impacts of housing inequality on well-being, based on the research question: 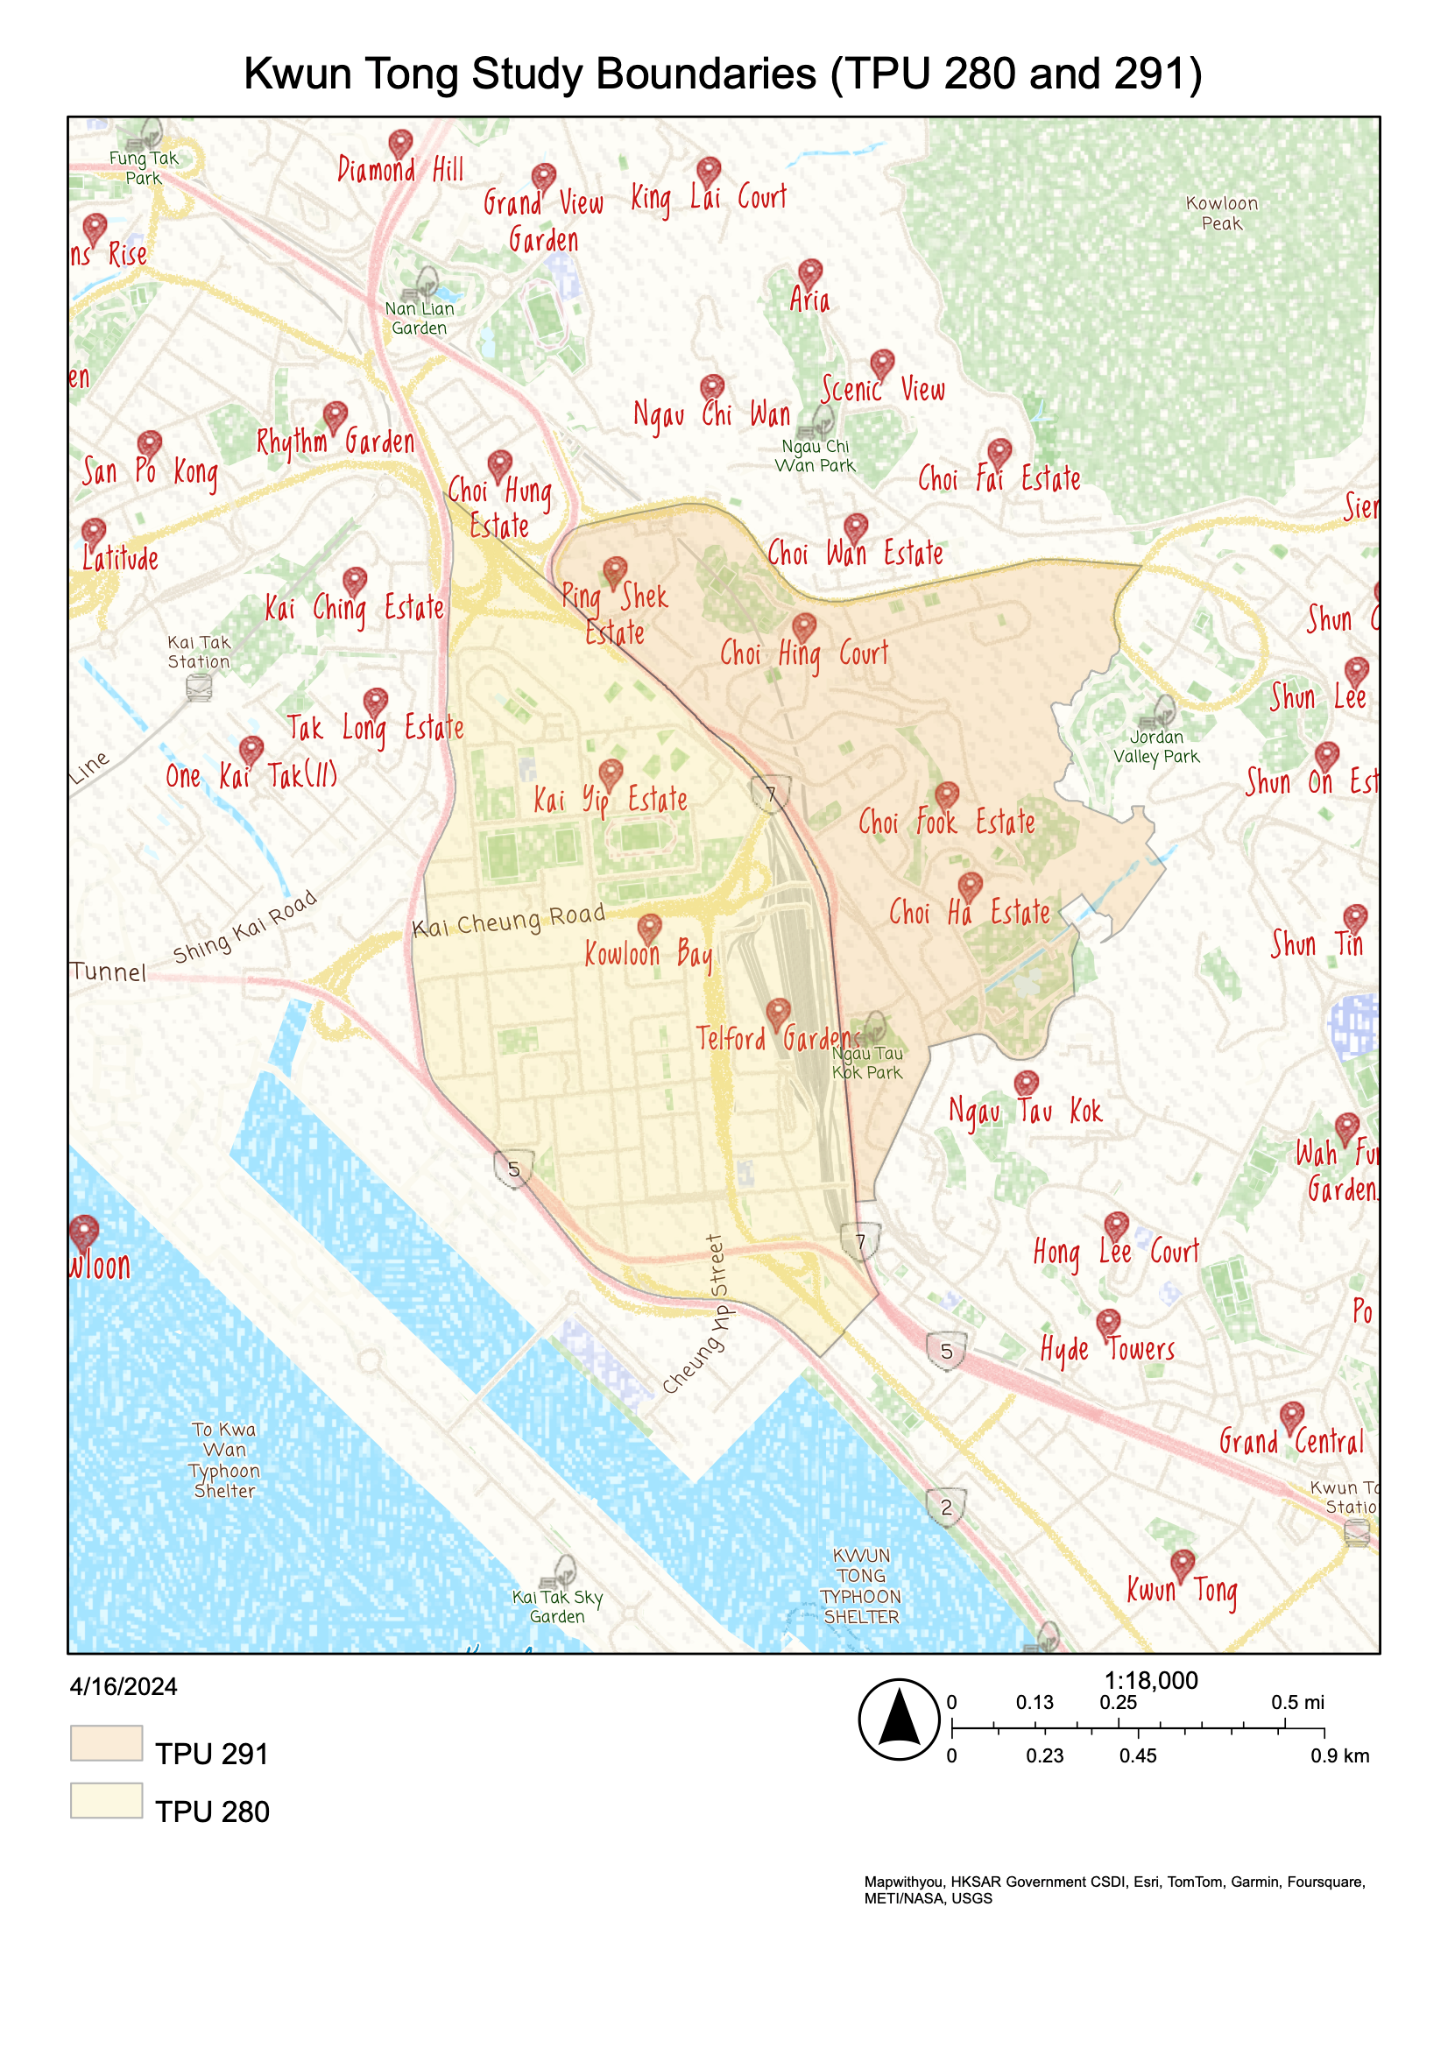 Figure 1: Boundaries of study location (Tertiary Planning Units 280 and 291).
Map created with data from (Esrichinahk).
To what extent does the impact of income on housing affect an individual’s well-being and the level of trust and collaboration in the Kwun Tong community?
About Kwun Tong
Timeline
Based on (觀塘工業區的活化和發展研究), (Kwun Tong District Council).
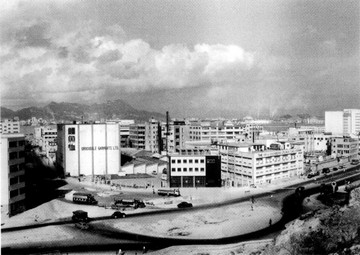
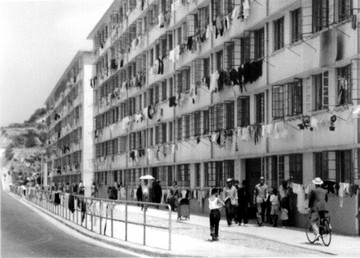
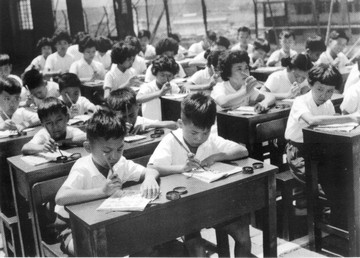
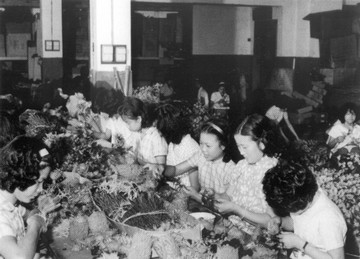 Figures 2-5: historical images of Kwun Tong. Images adapted from (Kwun Tong District Council). Figure 2: Industrial buildings, Hoi Yuen Road, Kwun Tong Road (1963). Figure 3: Garden Estate (1960), earliest public housing estate in Kwun Tong. Figure 4: Rooftop schools were the primary method of education in Kwun Tong during the 1960s.
As the people gradually moved into public estates, schooling also moved away from rooftops and
into institutions. Figure 5: Plastic flower factory (1960s). Advancement of technology in China led to
manufacturing migration towards the Mainland.
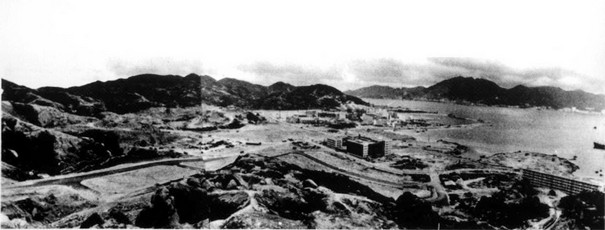
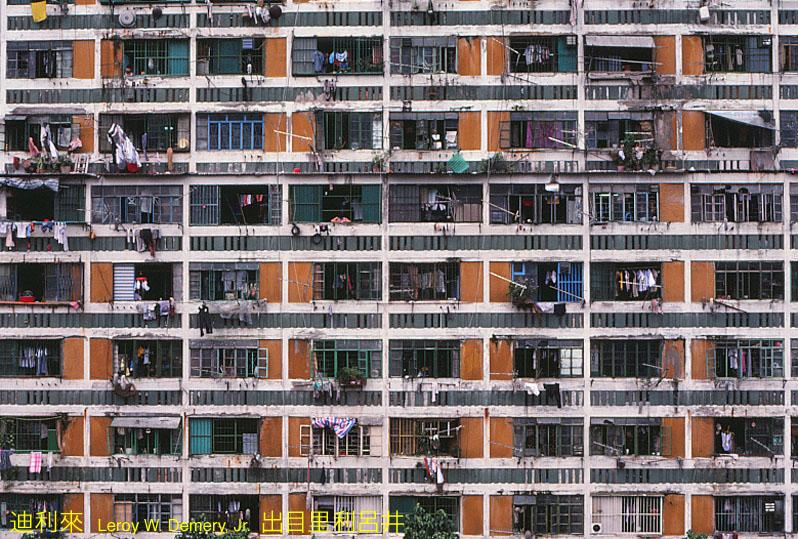 Lower Ngau Tau Kok Estate in 1980 (before demolishment during the early 2010s) (Demery).
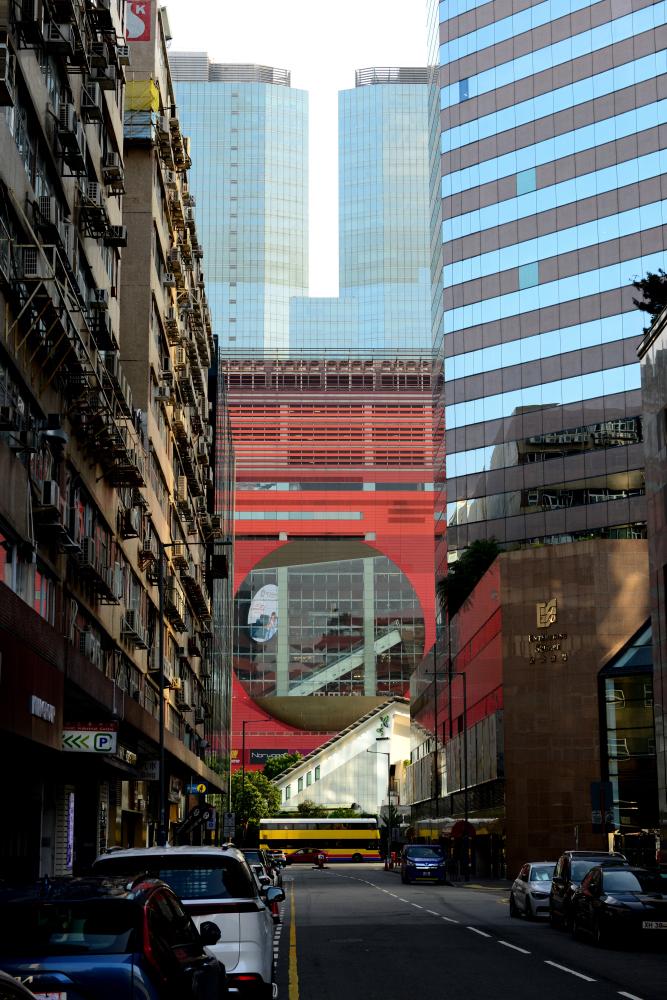 Figure 7: the vividly colored Megabox stands out amongst older composite buildings and newer
workplace areas (2022). Image from (Blue Lapis Road).
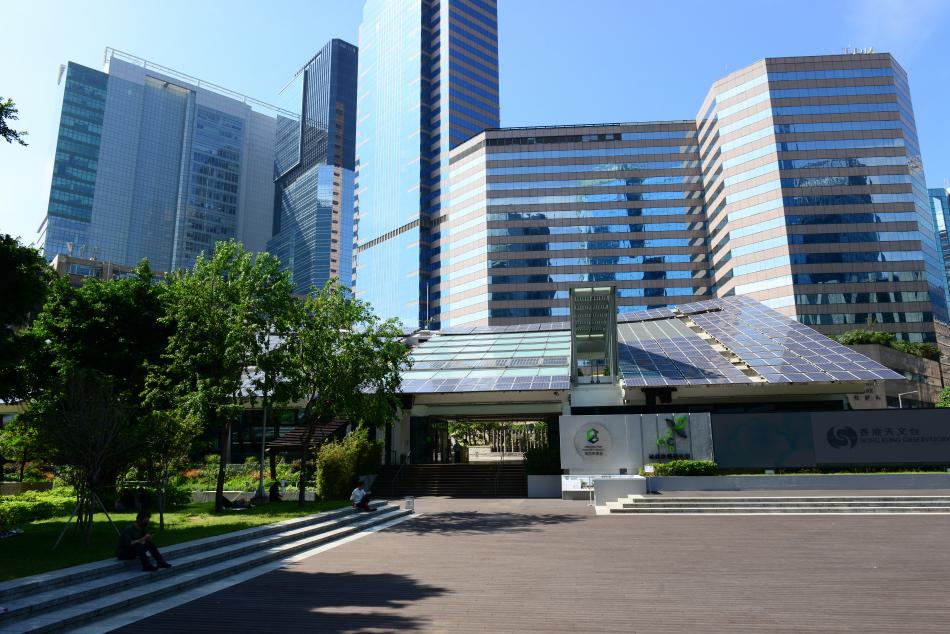 Figure 8: Innovative and creative infrastructure and organizations have taken root in Kwun Tong.
Zero Carbon Park and Building (2022). Image from (Blue Lapis Road).
1950s
Major developments in Kwun Tong began after World War Two (post-1950s). At the time, many factories brought in large reserves of resources, leading to the development of various industries in Hong Kong. As developments began to occupy areas such as Ngau Tau Kok and Tsuen Wan, the government decided to expand to Kwun Tong.
1960s
By 1961, Kwun Tong developed into an industrial area with over 60 large-scale buildings and over 90 companies that manufactured various products, such as clothing, cosmetics, medicine, furniture, electronics, paints, paper products, and more. Furthermore, Kwun Tong became the first New Town and New Industrial Development Area under government efforts to develop satellite cities.
Satellite cities – cities designed to be employment and population centers.
1970s-1980s
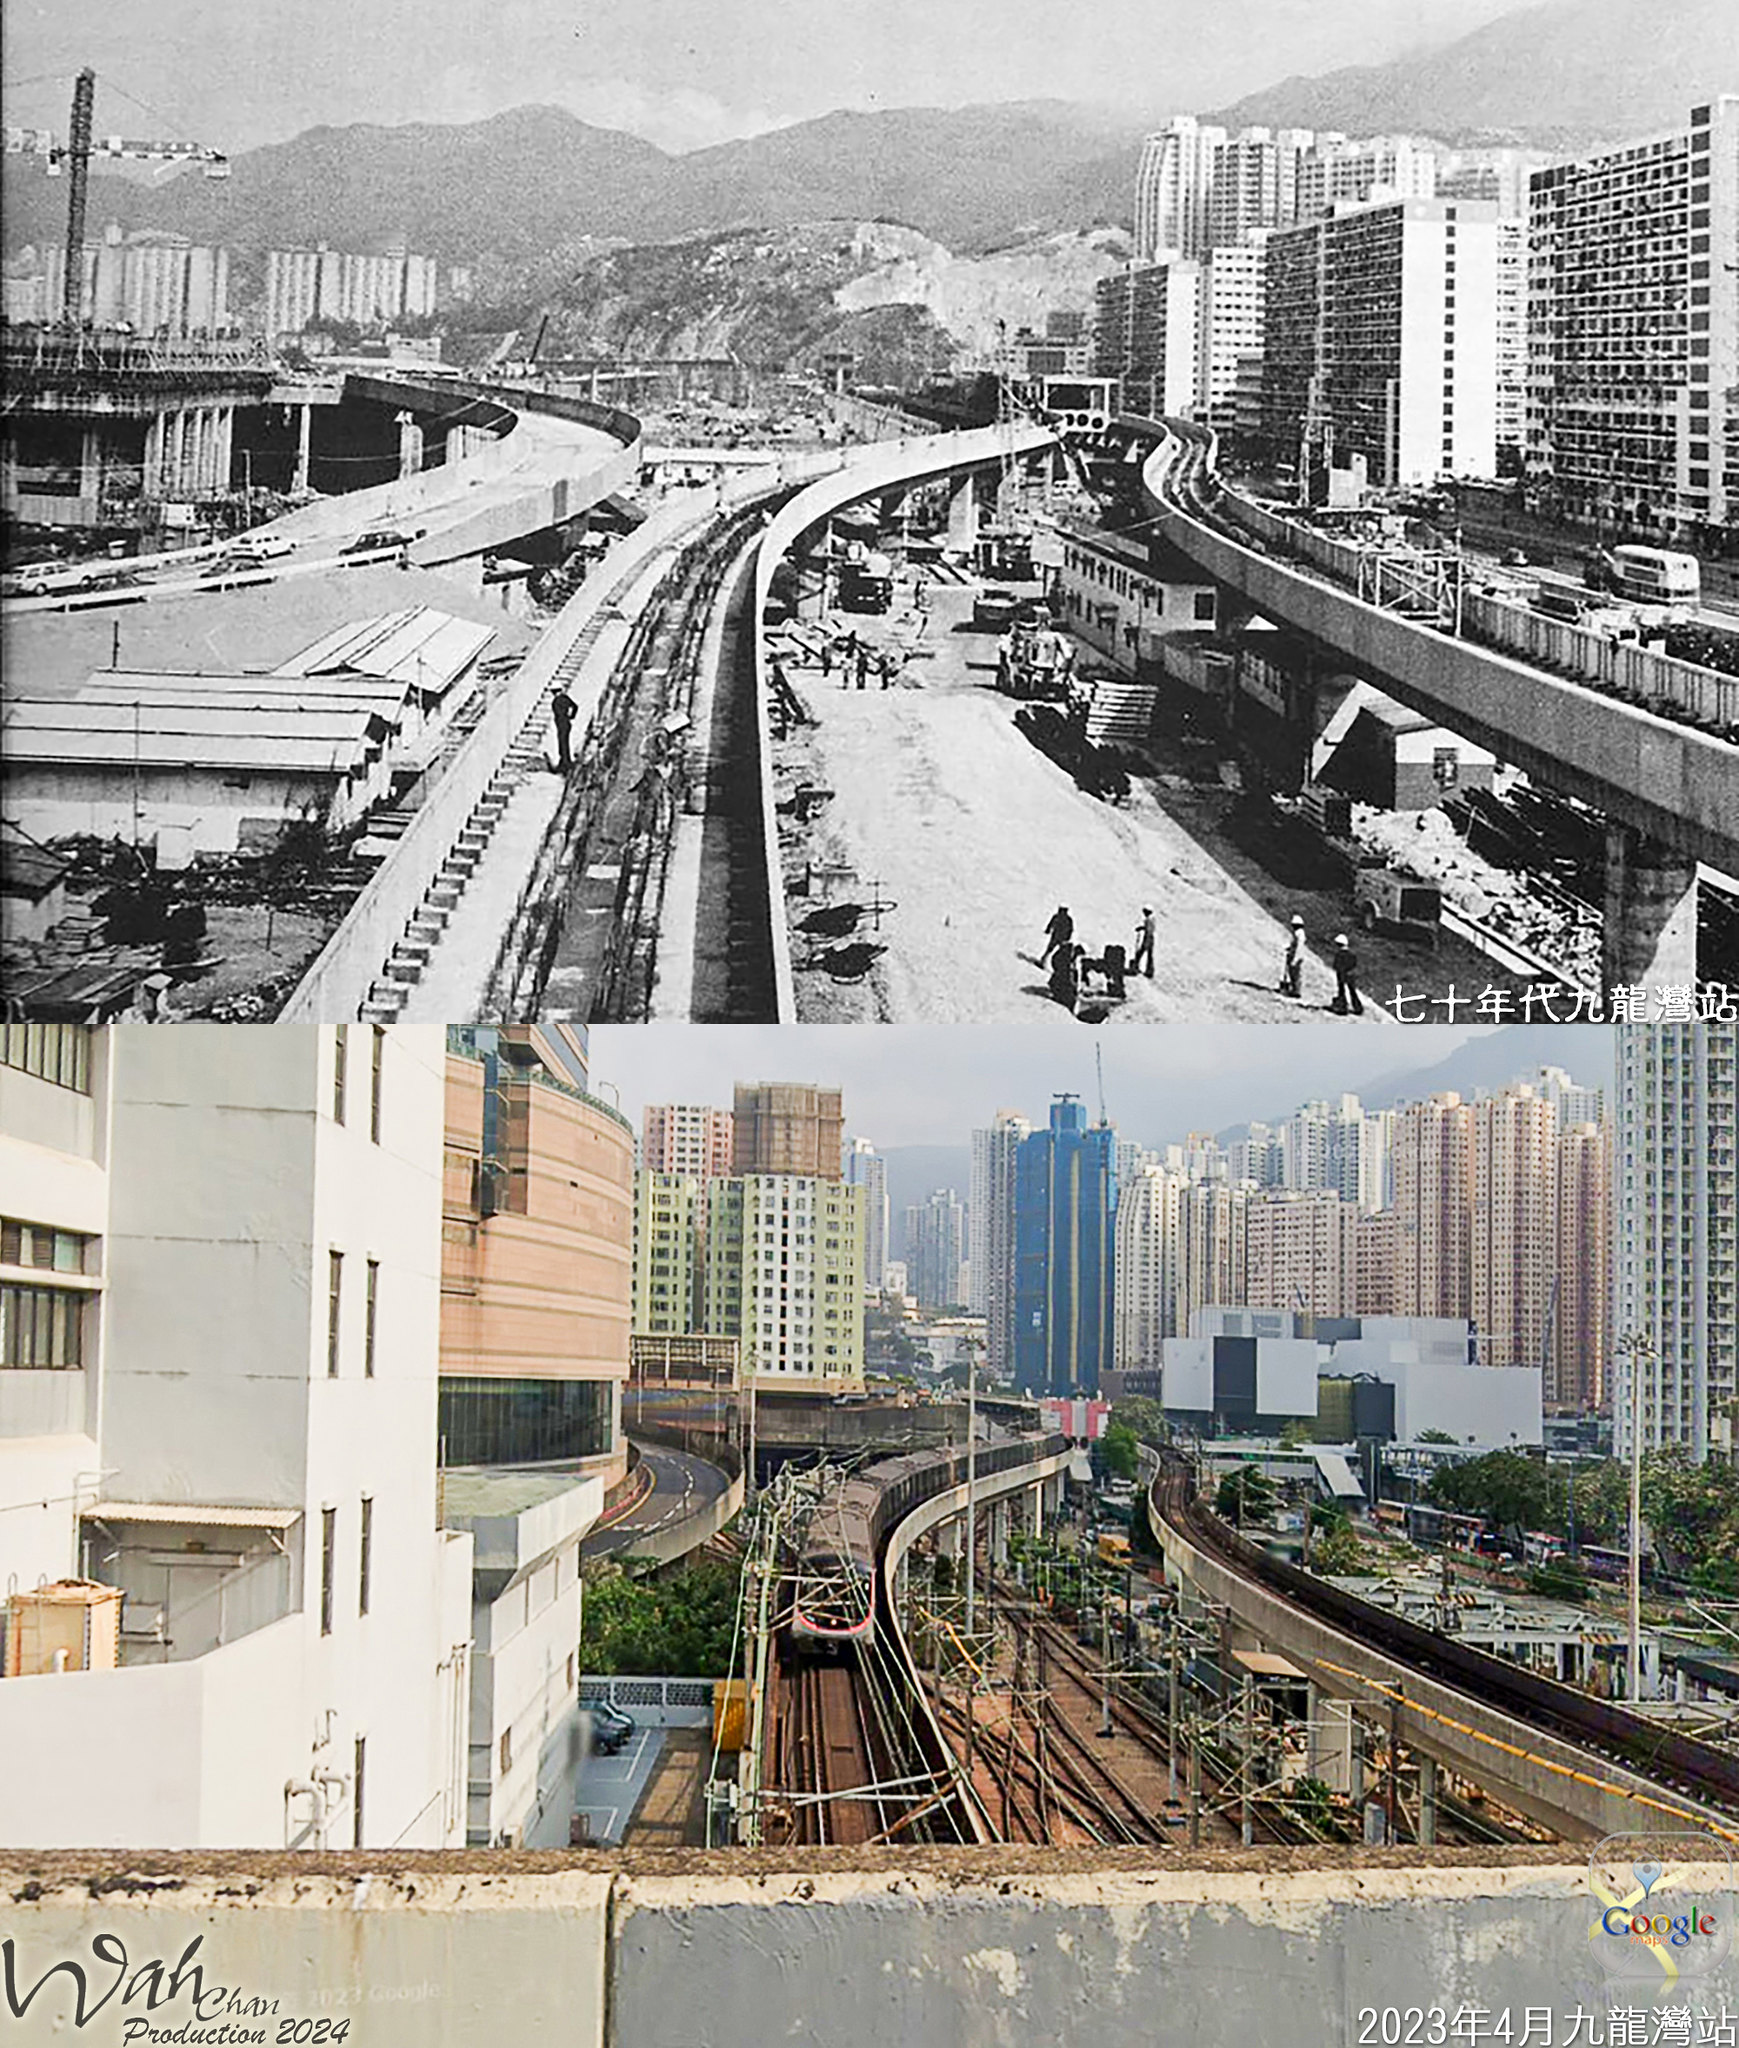
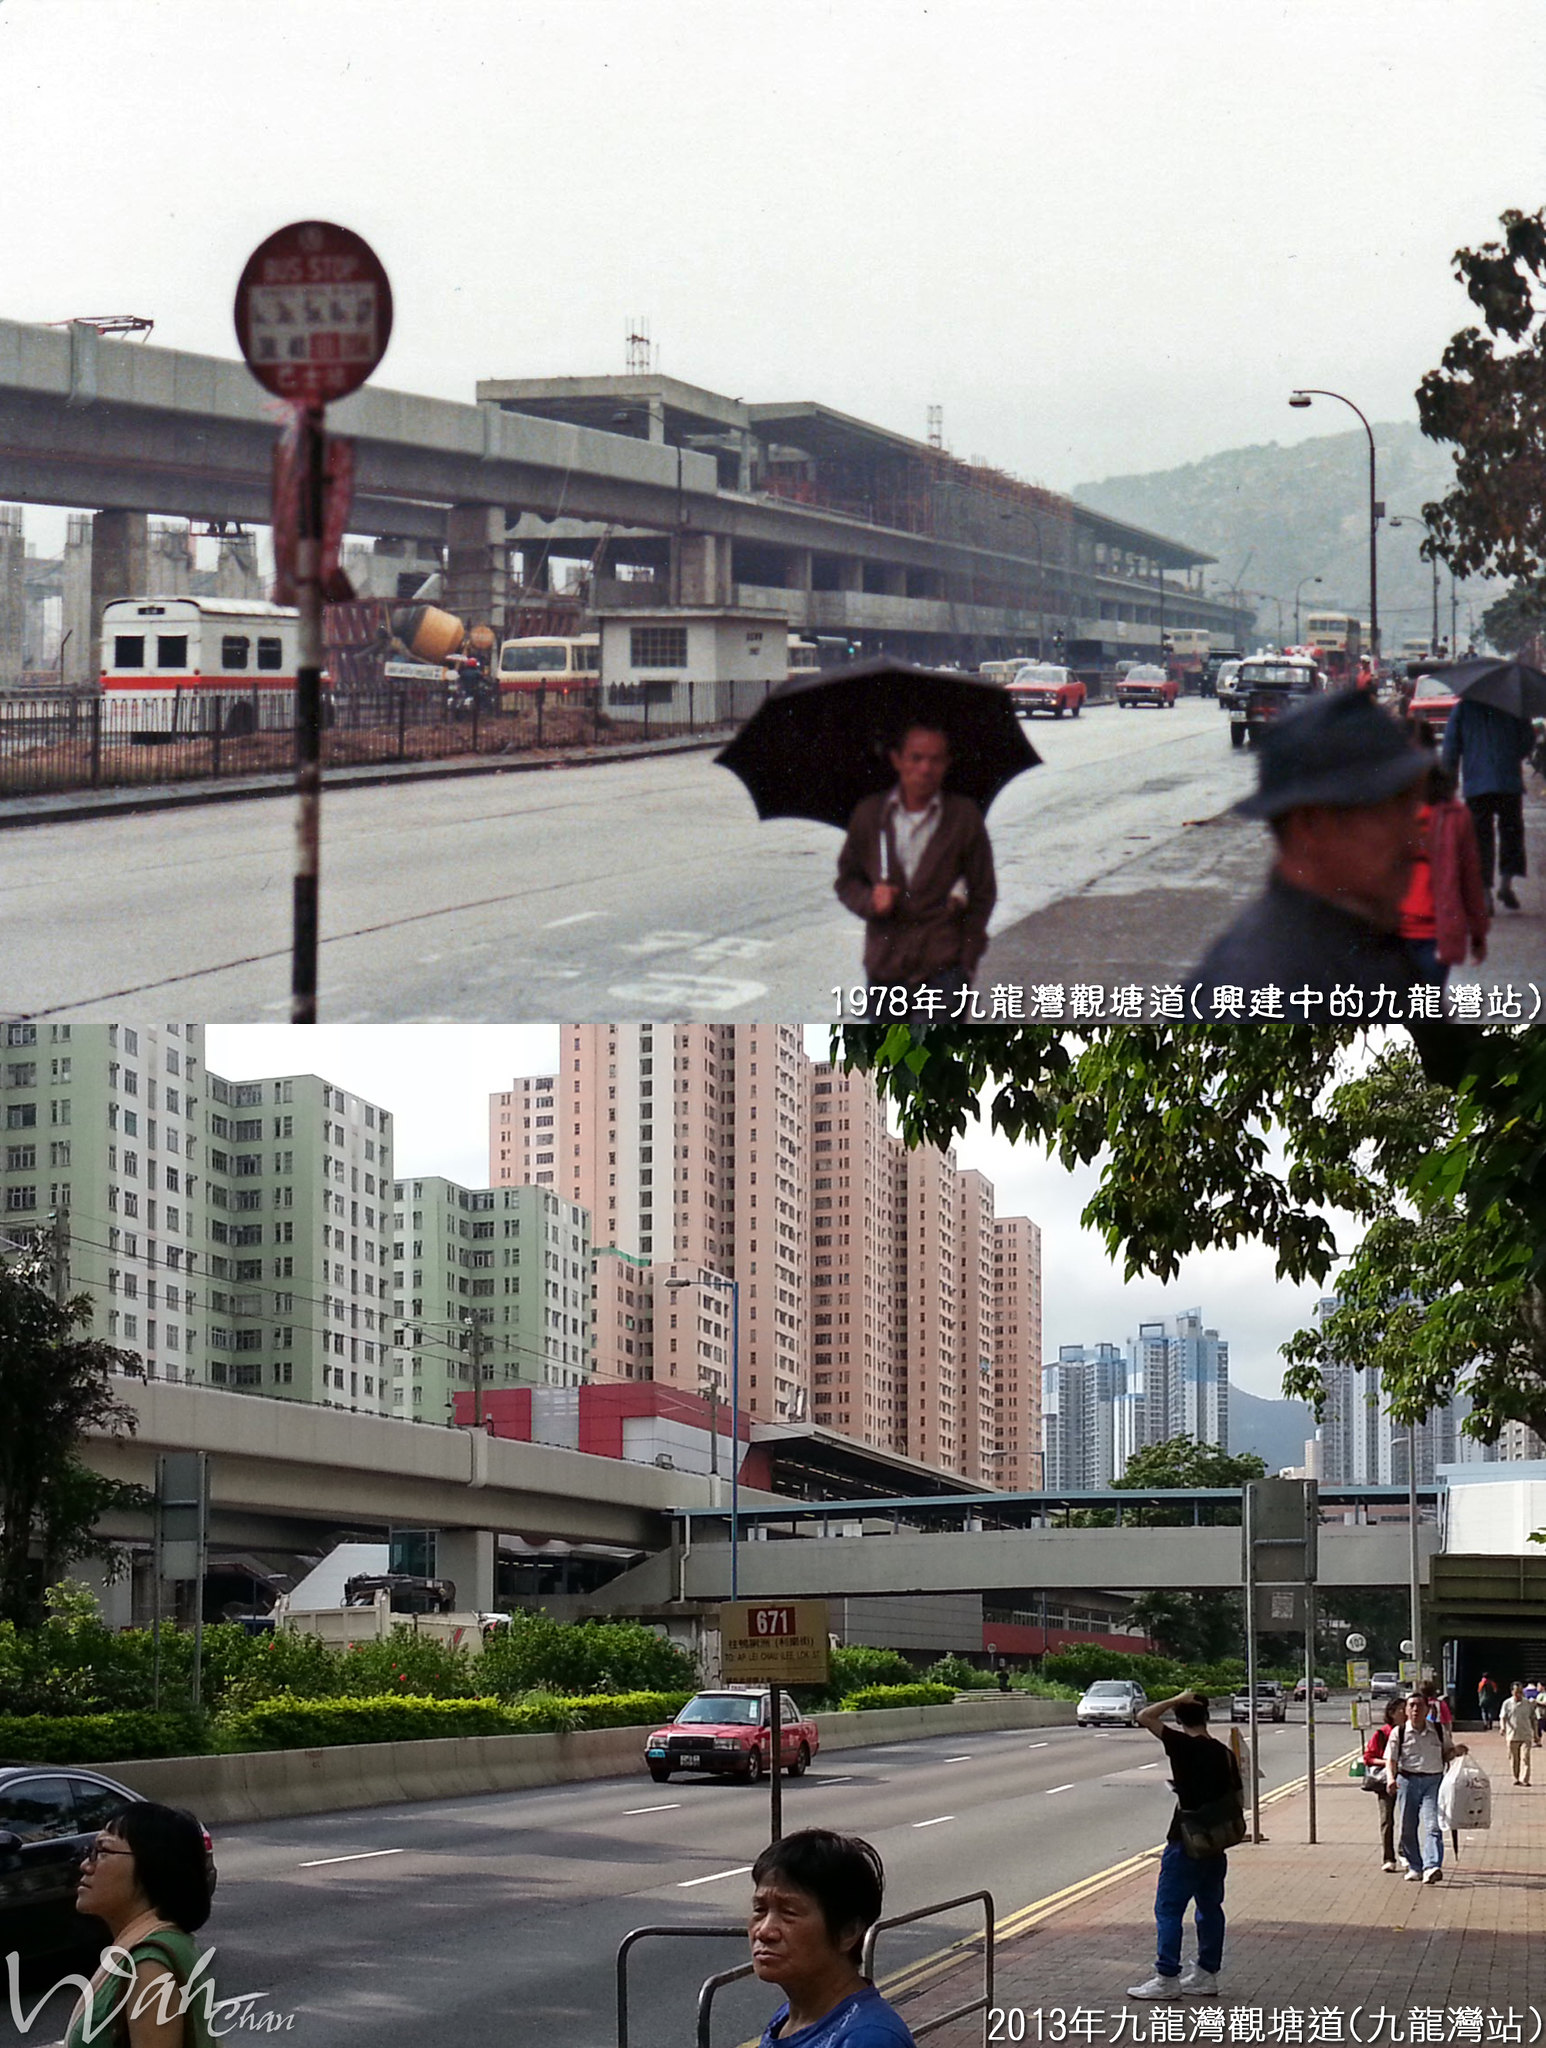
During the late 1970s, the Kwun Tong metro line was built, connecting Kwun Tong with Kowloon East and other regions, enhancing the transportation and traffic throughout the region. From the late 1970s to early 1980s, economic reforms in China led to a rapid decrease in human labor costs in mainland China, resulting in the migration of most manufacturing businesses to the north. The vacated industrial buildings were transformed into office buildings and composite buildings (e.g., Amoy Gardens and Laguna City).
Composite buildings – commonly found in Hong Kong, composite buildings consist of shopfronts and workshops at the ground level, and living quarters on the top.
1990s
By the 1990s, the northern migration of manufacturing lightened the industrial footprint in Hong Kong. The Kowloon Bay Industrial Area consequently transformed into a commercial area with office buildings, storage/warehouse spaces, and more. Drops in rental prices attracted many creative industries, non-profit and cultural organizations, and special shops to take root in the region.
2000s–
In 2007, the Urban Renewal Authority (URA) unveiled the Kwun Tong Town Center Redevelopment Plan, which aimed to reorganize and revitalize infrastructure.
In the 2009-2010 Policy Address, plans were announced to rebuild, revitalize, and redevelop industrial buildings in the Kowloon Bay industrial region.
There have been various development projects in recent years launched in or near Kwun Tong, including the Lei Yue Mun waterfront improvement project, the Ngau Tau Kok Lower Village redevelopment project, the Anderson Road development project, and the Kai Tak Cruise Terminal (situated at the old Kai Tak airport). They primarily focus on the revitalization of infrastructure, in line with government plans to further develop Kowloon East.
Notably, a study from 2009 indicates that the Kwun Tong industrial region (including Kowloon Bay, Kwun Tong,
and Ngau Tau Kok) is still primarily made up of manufacturing, commerce, and retail companies. (觀塘工業區的活化和發展研究). However, in the Kowloon Bay Industrial Area alone, approximately 36% and 27% of land
area is now purposed as workplace and storage environments, respectively.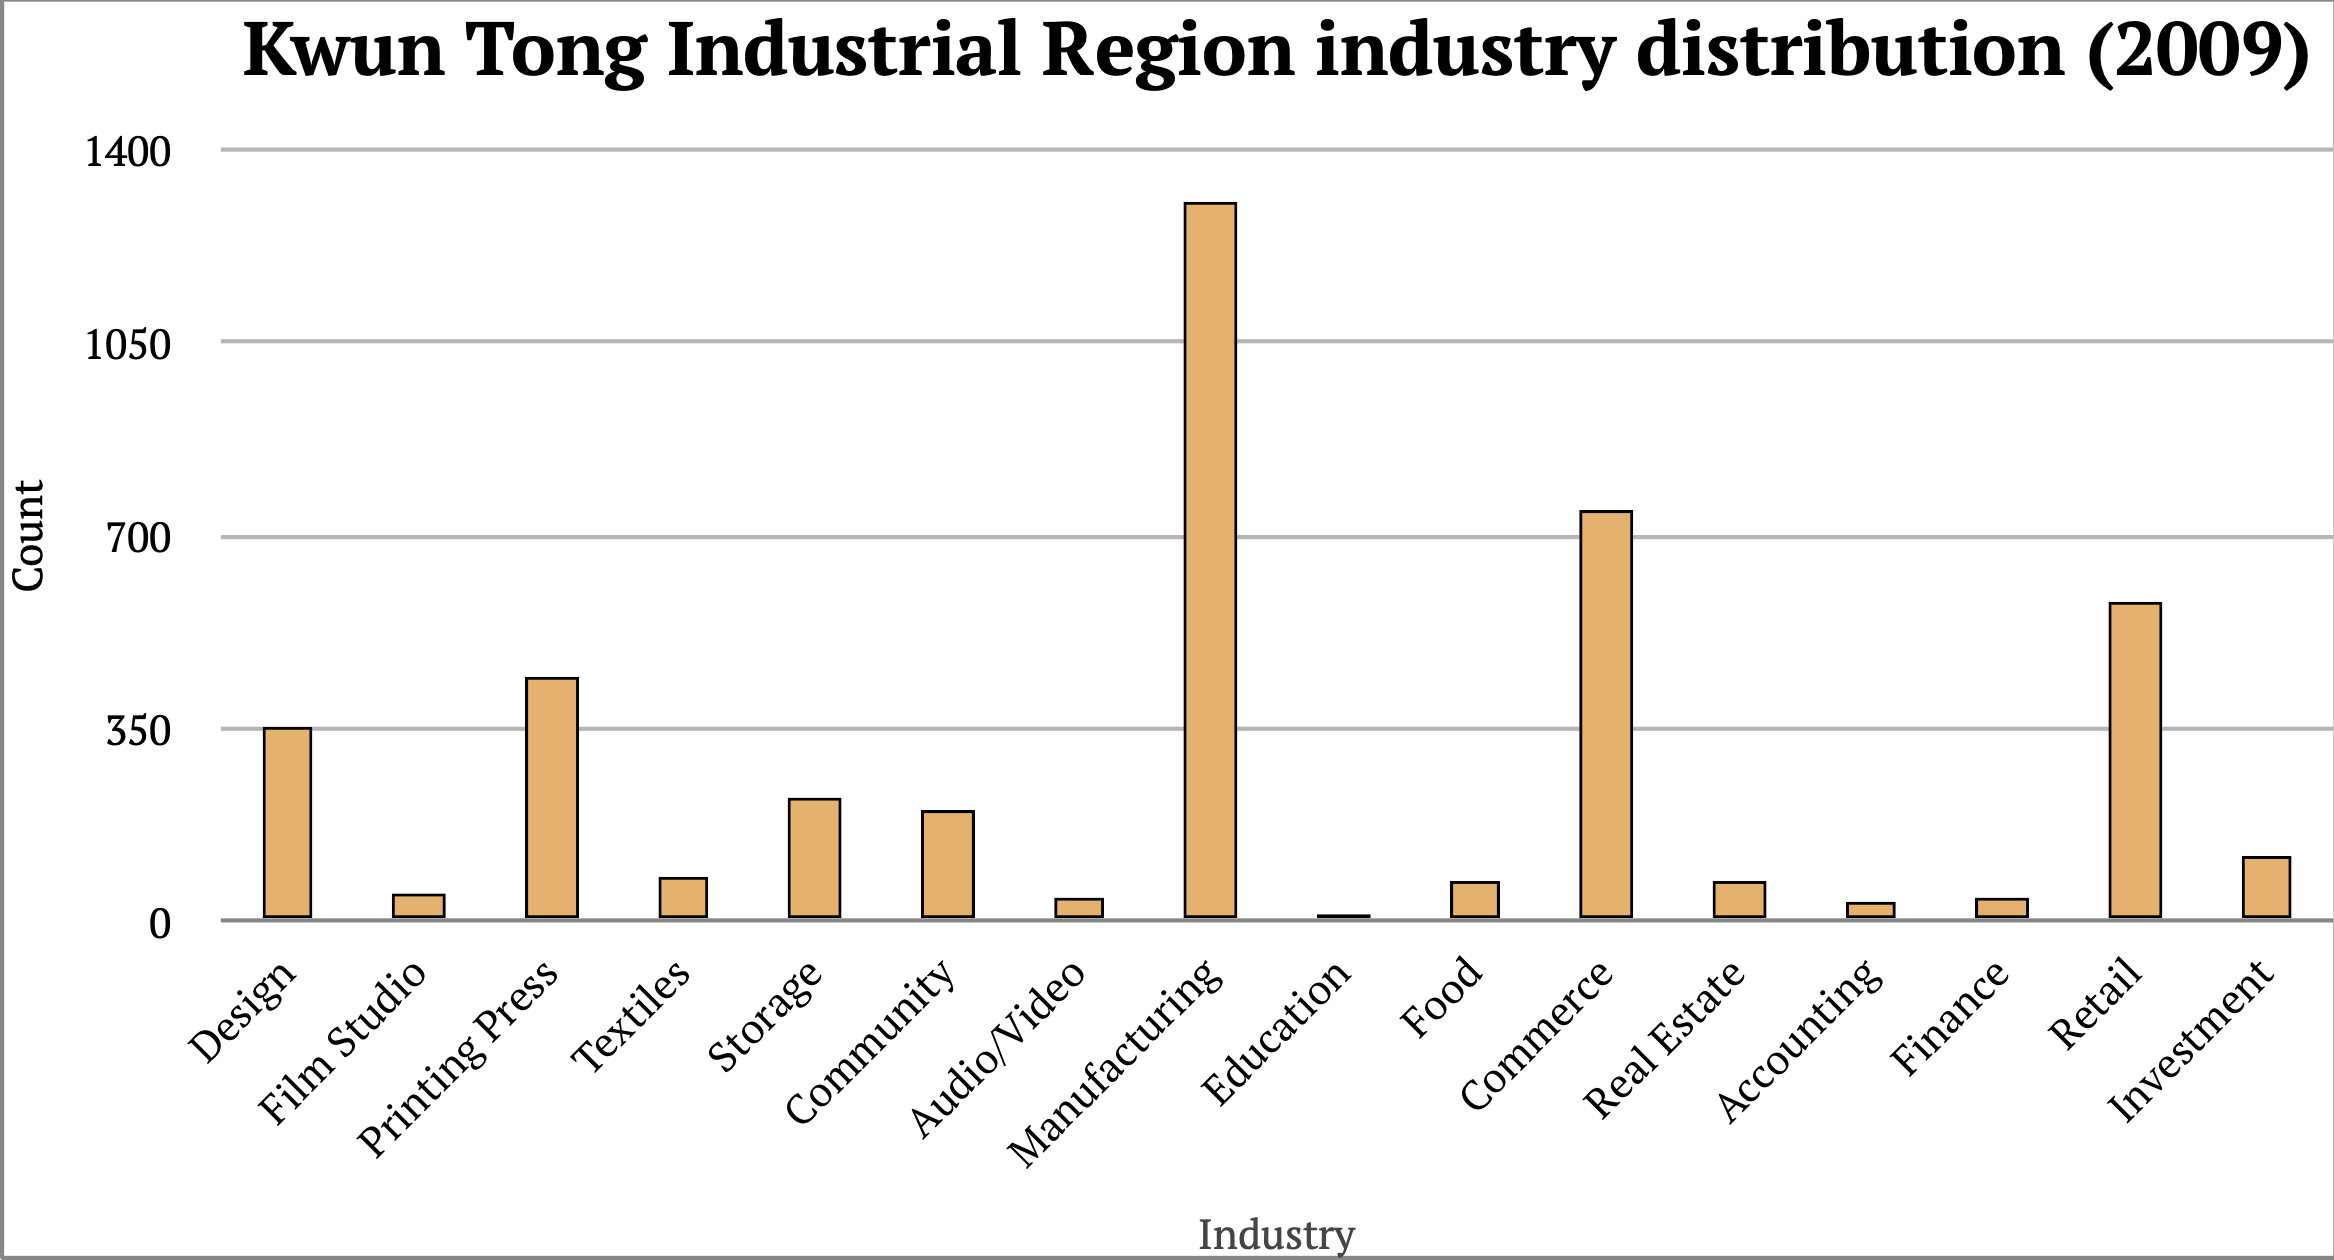 Figure 9: Kwun Tong Industrial Region industry distribution (2009).
Adapted from (觀塘工業區的活化和發展研究).
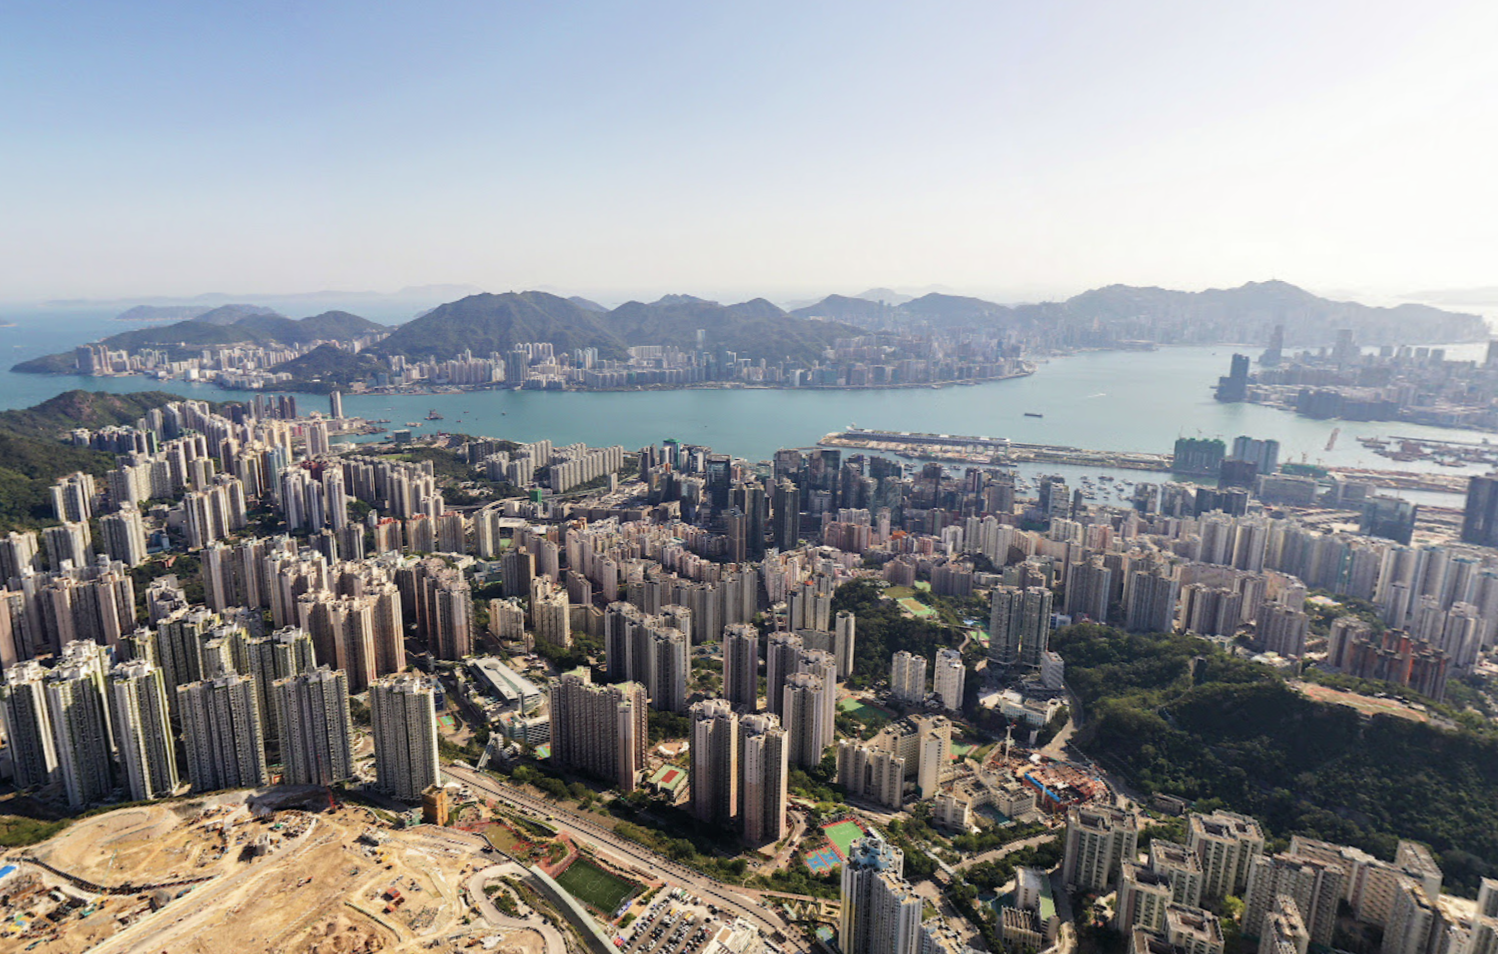
Past-Present Comparisons
Economic and Housing Characteristics
Data from the Hong Kong Census Bureau indicates that median household income of the 280 and 291 Tertiary Planning Units is around $22,800 (found by calculating a weighted average based on median household income and number of households by TPU), which is noticeably below the Hong Kong-wide median of $27,650. (2021 Population Census Office Census and Statistics Department). This indicates the study region is comparably poorer relative to other regions in Hong Kong, possibly because of its status as a former industrial area lacking significant commercial activity.
Notably, surveys on building maintenance in the industrial area indicates that most buildings could be of better
quality, highlighting the lack of economic support in the region to provide regular maintenance and perform
repairs, as compared to more economically active regions such as Central.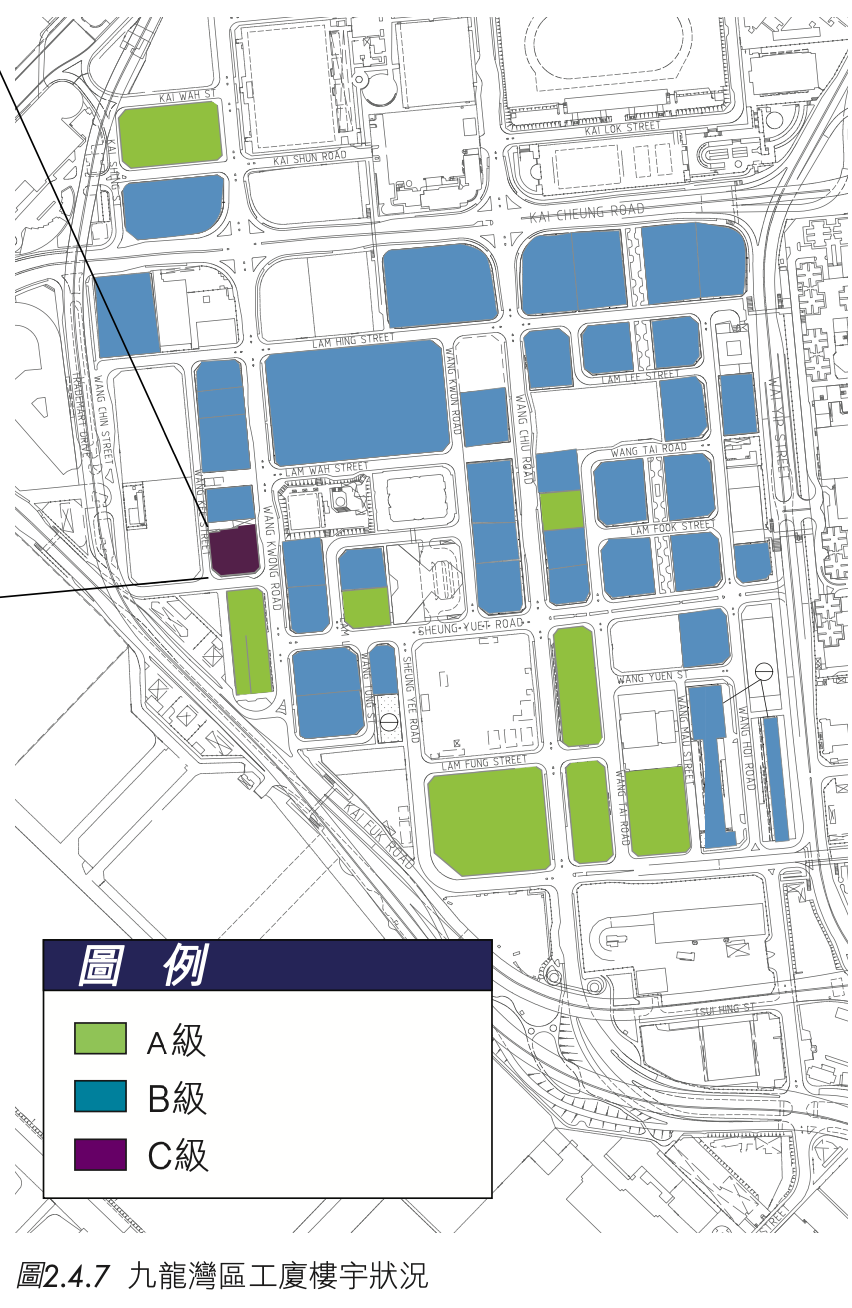 Figure 14: Building quality, Kowloon Bay Industrial Area. Adapted from (觀塘工業區的活化和發展研究).
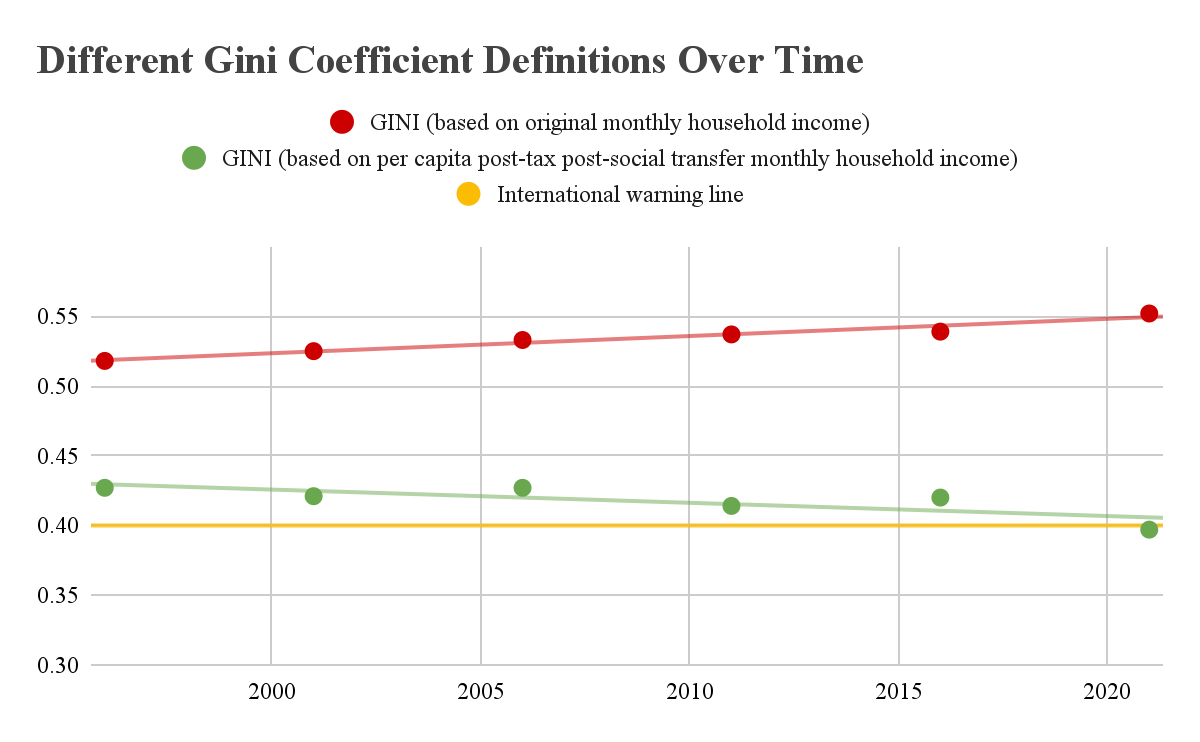
Gini coefficient data on Hong Kong indicates that income inequality as measured by original household income is increasing at a rate of approximately 0.006 every five years. However, the Gini coefficient as measured by per capita post-tax post-social transfer monthly household income (after redistribution policies such as taxation and welfare) is decreasing at a rate of approximately 0.005 every five years. This highlights that although the perceived level of household income inequality is decreasing, it is primarily due to redistribution policies. Without intervention, income inequality is growing.
This is a problem as increasing income inequality requires more government intervention and measures to be reduced, highlighting the increasing inequality in Hong Kong society.
The impact of the COVID-19 pandemic on income inequality is well-documented, with studies indicating an exacerbated effect on income inequality. (Kang and Koo). Gini data highlight this impact in the noticeably greater difference between the 2016 and 2021 census data points.
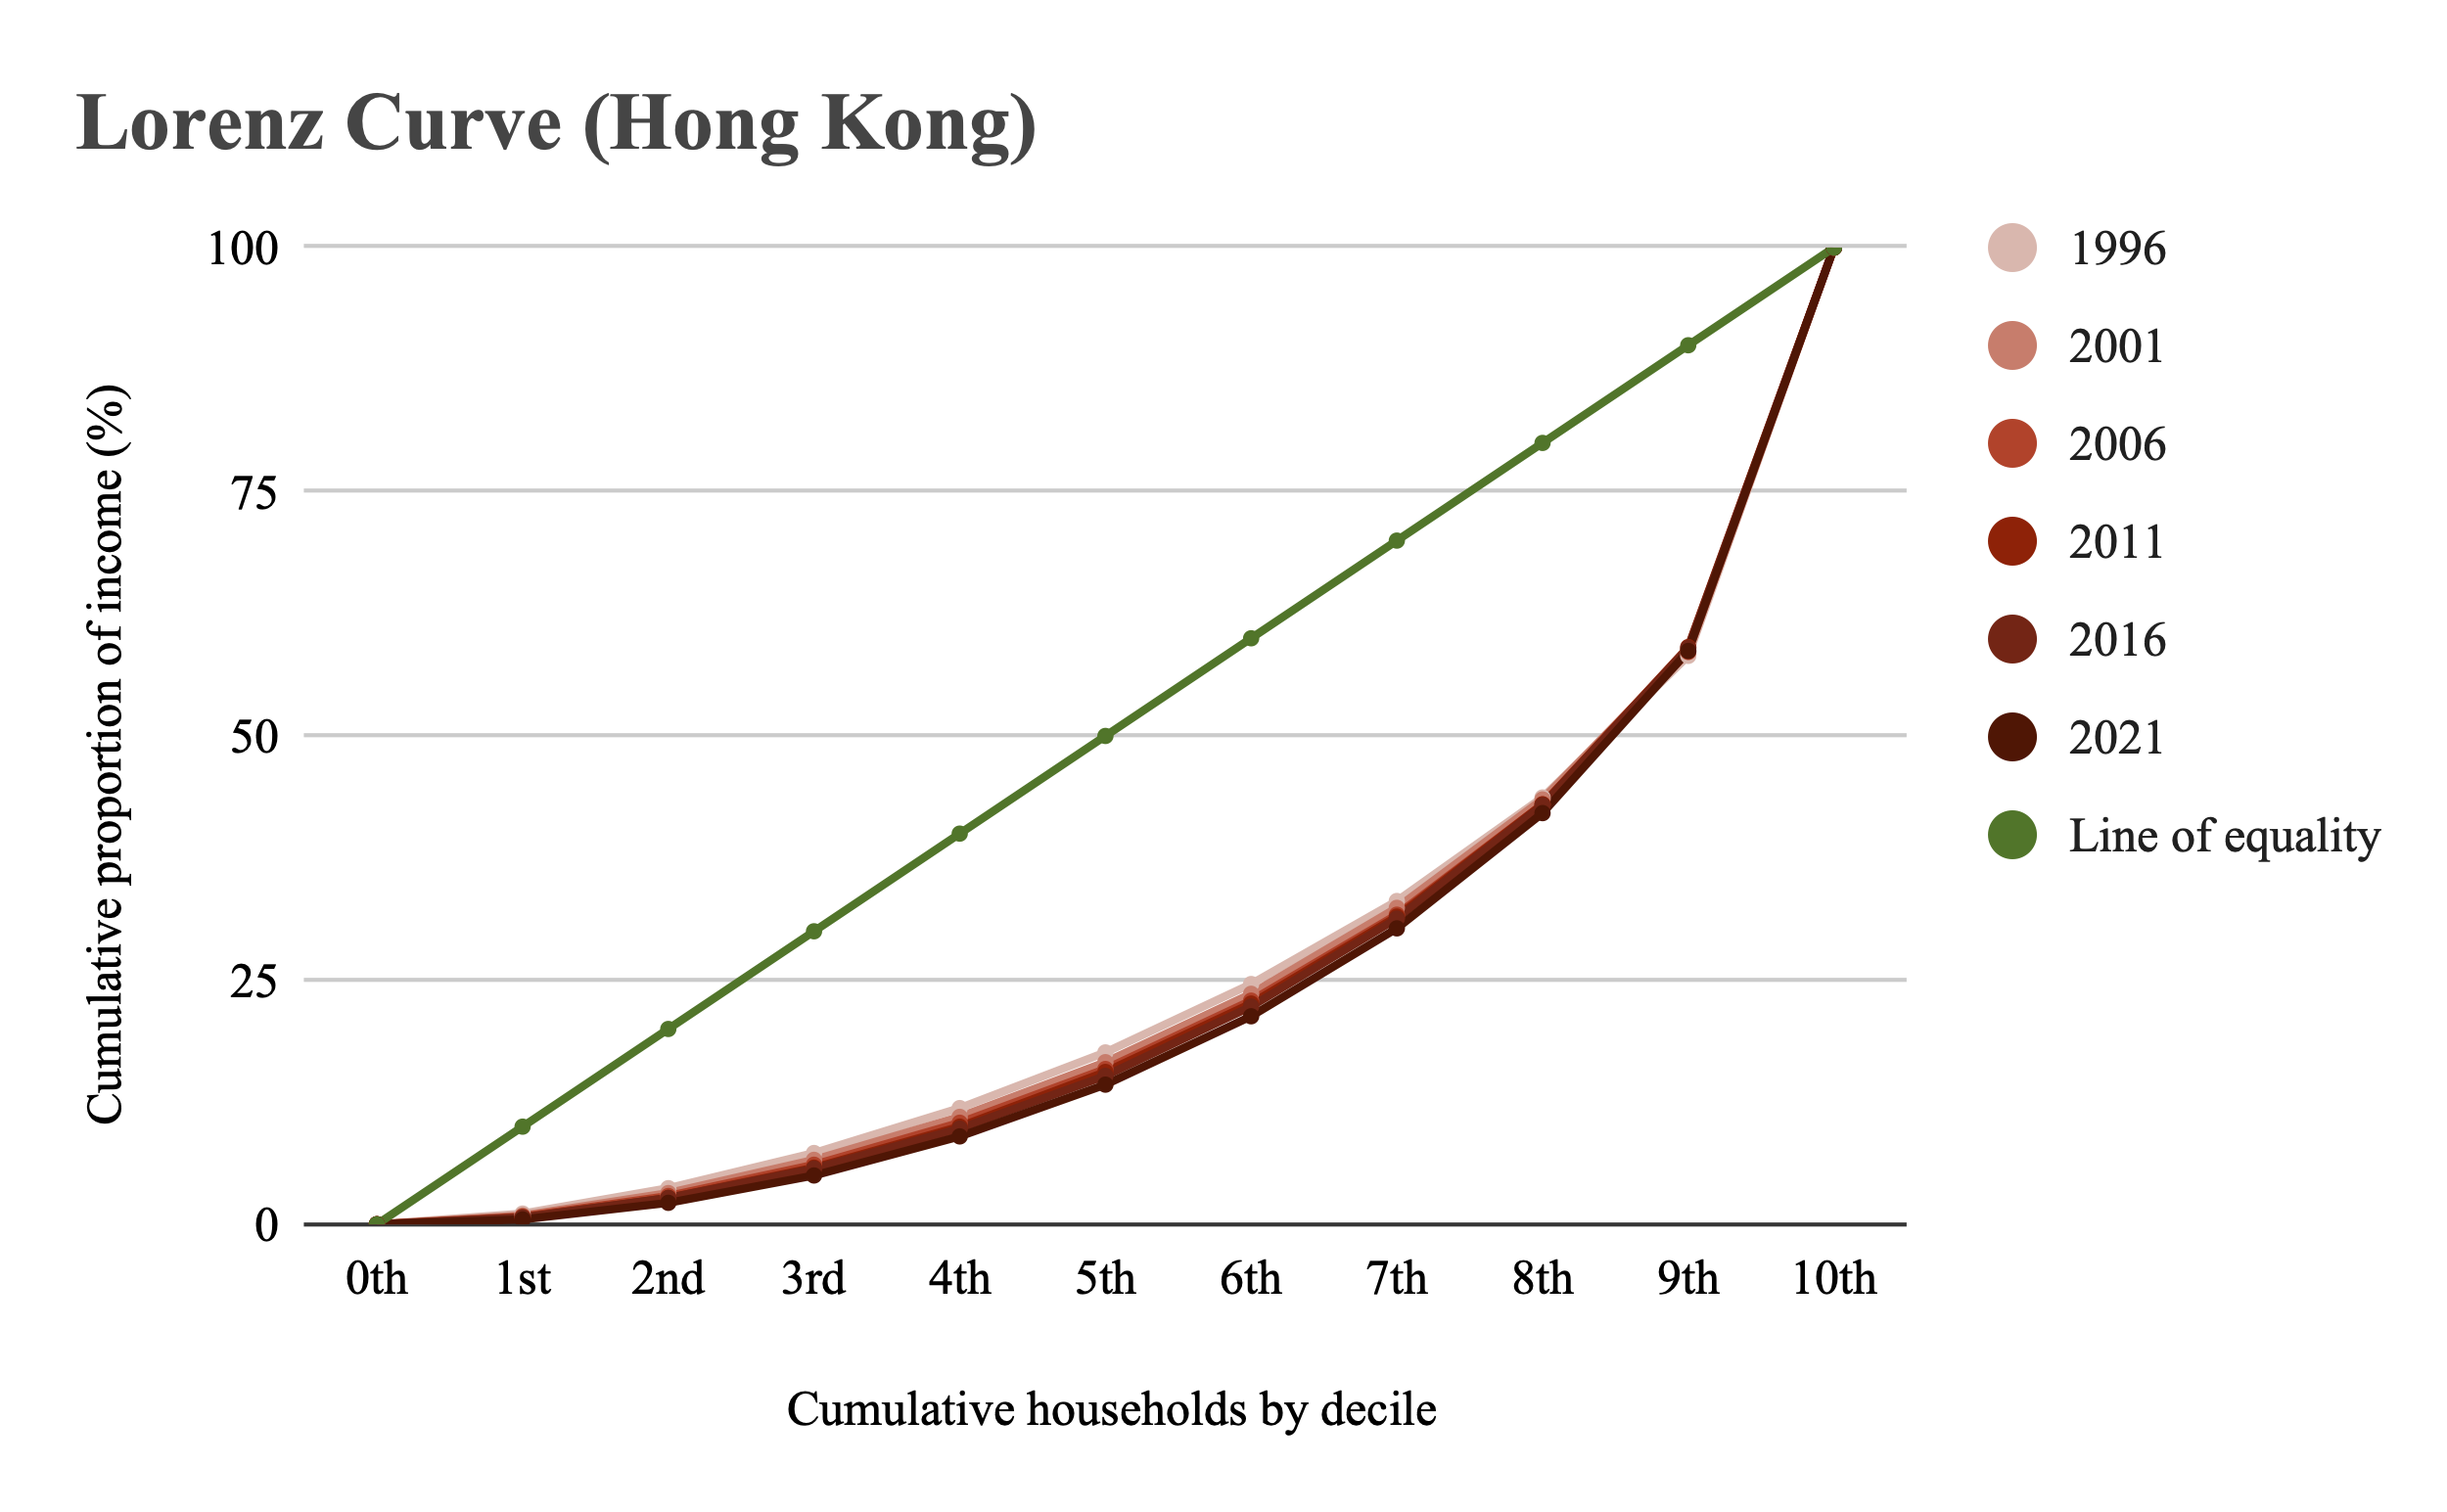
The Lorenz curve highlights the growing inequality in original household income, and the deterioration of original household income inequality. Differences are particularly notable around the median deciles. This phenomenon was observed on the Hong Kong-wide scale…
…and also on the local scale in TPUs 280 and 291.
Notably, the curves are closer to the line of equality for the Lorenz curve on the TPUs, indicating that inequality in the study area is smaller than on the Hong Kong-wide scale.
Lorenz curve was created based on raw data extracted from 1996, 2001, 2006, 2011, 2016, and 2021 Population Census Office Census and Statistics Department data. Decile wealth proportion was calculated based on data on monthly original household income distribution by Tertiary Planning Unit. Sourced from (Census and Statistics Department). GINI data taken from (2006 Population By-census Office Census and Statistics Department), (2021 Population Census Office Census and Statistics Department).
Notably, housing size and income tend to be greater in TPU 280 (which encloses the Kowloon Bay Industrial Area) compared to TPU 291. Census data indicates median floor area for housing is 41m² in TPU 280, compared to 31m² in TPU 291, however, around 88,000 people live in TPU 291 compared to around 39,000 in TPU 280. (2021 Population Census Office Census and Statistics Department).
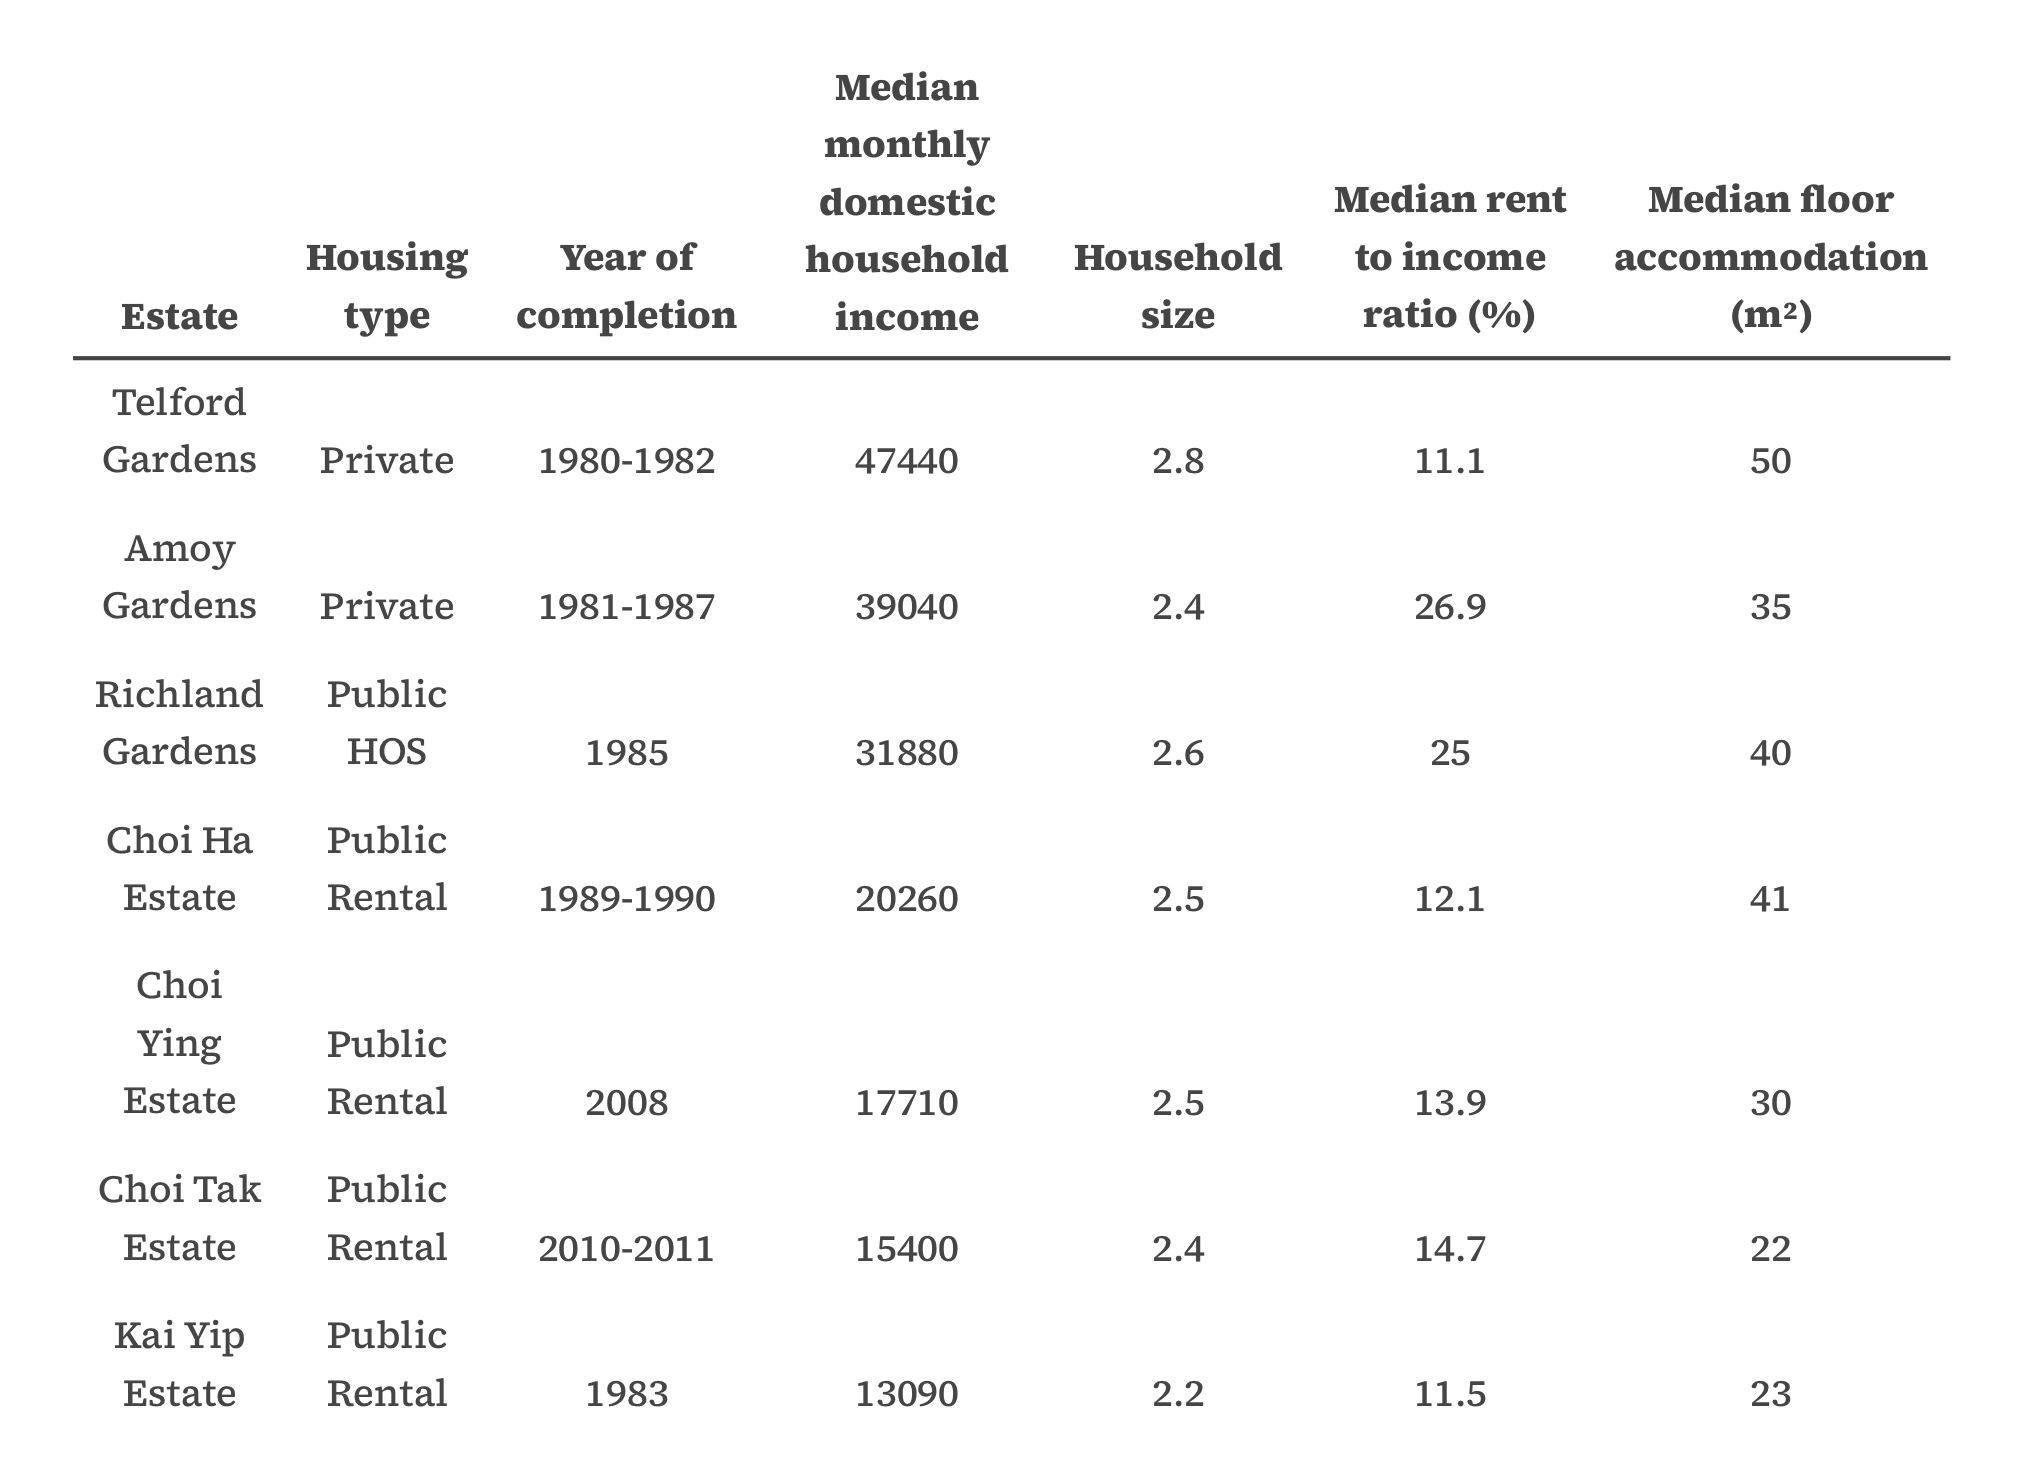
Furthermore, a comparison of median housing size and income by housing estate highlighted interesting details:
- Households in private housing had bigger homes (approximately twice as big as public rental housing units), household size, and income (two to three times greater).
- Housing size tends to decrease with year of construction. Decreasing public housing sizes likely indicates government attempts to keep housing affordable (given the rising land prices) by increasing the concentration of units per area.
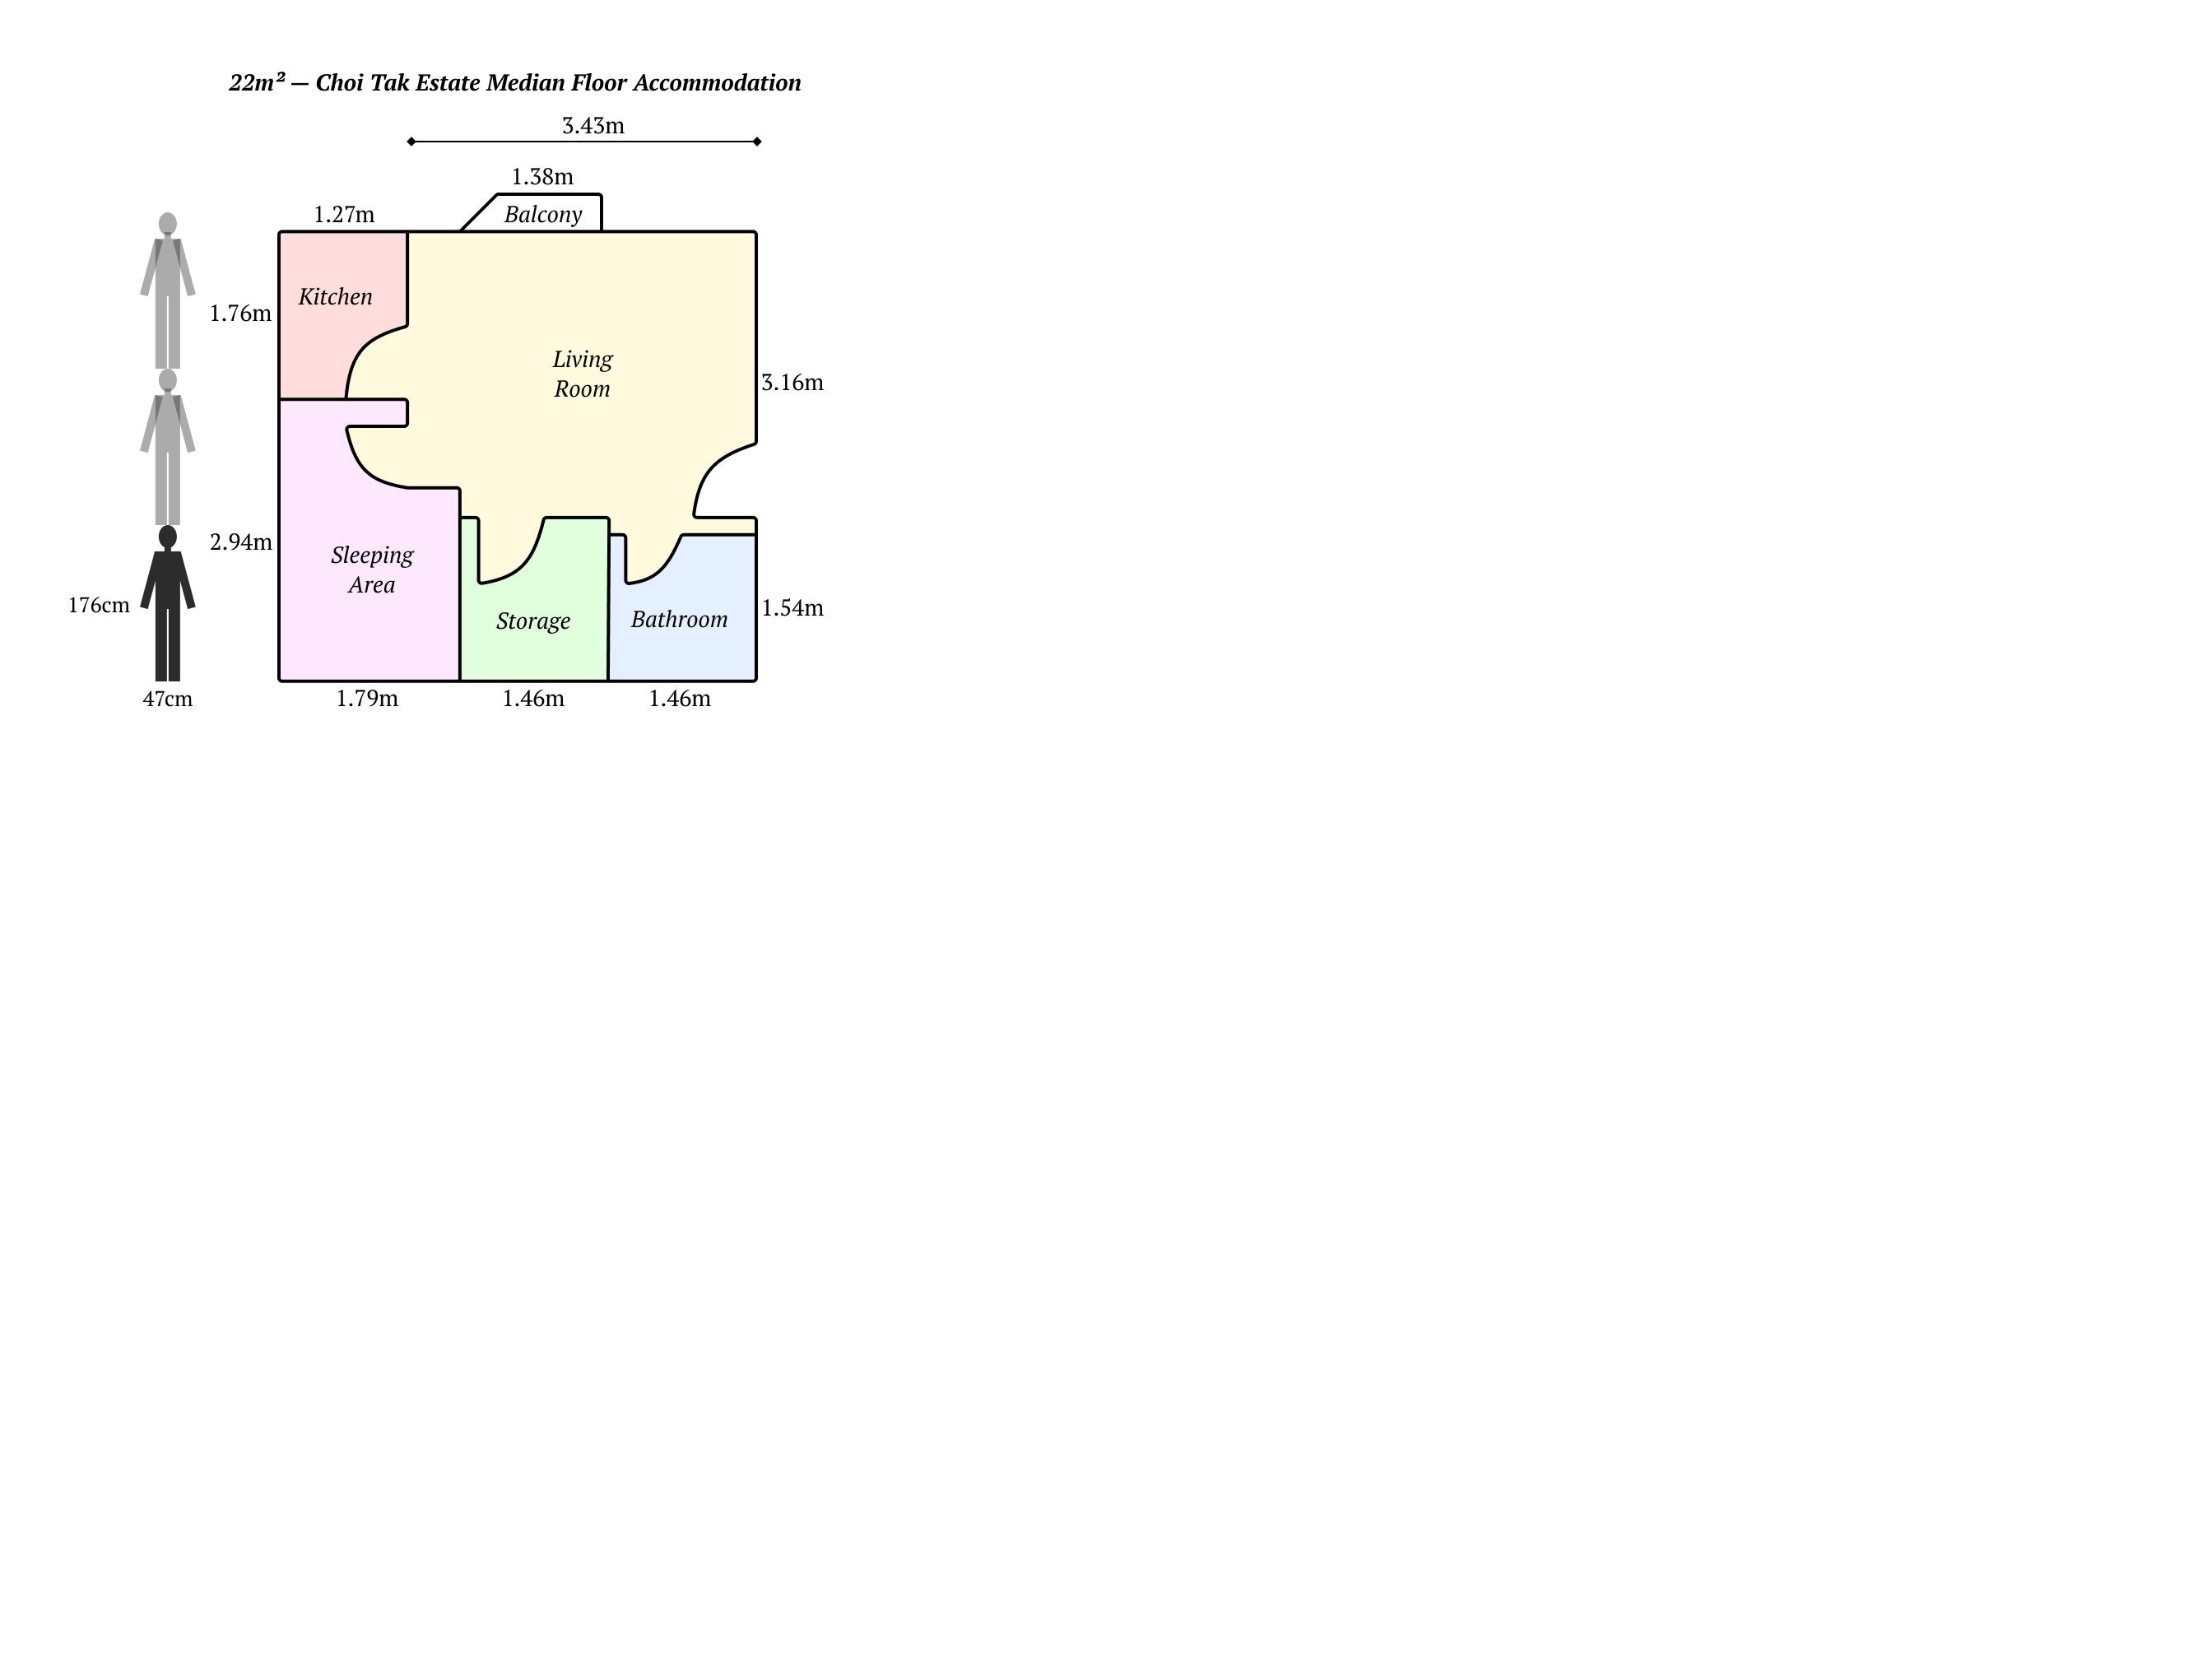
In context the median size of housing in Choi Tak Estate (public housing) is 22m², approximately the size of a rectangle with the height of three people placed head-to-toe and width of two and a half people placed head-to-toe…
…in contrast, a luxurious apartment (private housing) exclusively accessible to those willing to pay a base monthly rental price of $60,000-150,000 usually has more than 140m² of floor space.
Figure: comparison of public housing and luxurious private housing. Floor plans and sizing from (Centaline Property) and (“Luxury Apartments”).
Field Study
Study Design
With a better idea of the state of housing and income inequality in the region, we turn to study the state of well-being of individuals and the community, and attempt to draw causal relationships between housing/income inequality and well-being.
It is logical to hypothesize that increasing housing and income inequality would reduce individual and interpersonal well-being, as increased inequality leads to division in interaction between social classes and leads to the separation and isolation of individuals and communities. To find out if this is true, we first identify measures and indicators of well-being.
Individual and household well-being can be measured in various manners. The Hong Kong Family Welfare Society and Hong Kong Public Opinion Research Institute surveyed around 2,000 respondents to formulate a quantitative measure of well-being, denoted the “Family Wellbeing Index”. They consider various factors, grouped into six primary groups: family solidarity, family resources, family health, social connection, social resources, and work-life balance. (Hong Kong Family Welfare Society and Hong Kong Public Opinion Research Institute). Notably, they found that well-being deteriorated over COVID-19, with the index dropping from 6.31 (2019) to 6.10 (2022), mostly due to “weakening social connection and social resources”.
Characteristics associated with lower well-being included:
- Lower household income or unemployment,
- Lower education attainment,
- Public housing residents,
- Being divorced or widowed,
- Living in large families (more than 5 members),
- Being in single-parent families,
- Having families with members in need of special care, and
- Being in a family that has faced difficulties and crises lately.
Furthermore, the study found that vulnerable demographic groups were affected more than the rest of the population and that there is a widening gap between the well-being of low- and high-income families.
“To address the needs of low-income families, we should not only focus on poverty alleviation and provision of resources, but also work on improving family wellbeing at the same time to achieve better results, such as by strengthening family relationships.”
— Policy recommendations
Furthermore, (Hung) studied the impact of COVID-19 on the emotional and psychological health of the Hong Kong population. Studies found that “high percentages of anxiety, depression, post-traumatic stress disorder, psychological distress, and stress were found in the general population” and Hung’s research indicates that of 590 home-bound residents surveyed, “65.3% had a higher stress level, and 29.7% had moderate to severe depression because of being home-bound”.
The studies and results by (Hung) and (The Hong Kong Family Welfare Society and Hong Kong Public Opinion Research Institute) highlight the insights that can be inferred about demographics vulnerable to mental health challenges, based on the characterization of individual well-being through various indicators, such as family, social connections, and work-life balance. The Family Wellbeing Index research also highlights possible trends that can be found between housing and economic characteristics, and individual well-being.
As for community well-being, a notable indicator is social capital, which is often defined as one of the three:
- The resources individuals can access based on their relationships with others,
- The nature and extent of an individual’s participation in a network or civilian organization, and
- ‘Linking’ social capital: connections to those in authority. (Grootaert), (Ng).
Social capital is important due to its contribution to employment and economy, poverty alleviation, health and education, and crime reduction/prevention. (Ng).
“The individual is helpless socially, if left to himself… If he comes into contact with his neighbor, and they with other neighbors, there will be an accumulation of social capital, which may immediately satisfy his social needs and which may bear a social potentiality sufficient to the substantial improvement of living conditions in the whole community. The community as a whole will benefit by the cooperation of all its parts, while the individual will find in his association the advantages of the help, the sympathy and the fellowship of his neighbors.”
— L. J. Hanifan, an American reformer in the progressive era
The Social Capital Questionnaire (developed by the World Bank) was designed to gauge social capital, based on six areas:
- Groups and Networks
- Trust and Solidarity
- Collective Action and Cooperation
- Information and Communication
- Social Cohesion and Inclusion
- Empowerment and Political Action.
Studies from (Kang and Koo) and (Dai et. al.) employ the concept of social capital to perform regional studies on community well-being, concluding that trust is reduced when housing, property, wealth, and income inequality increase, with the effect more noticeable in lower-class or lower-income individuals and households.
In our field study, we take inspiration from the design of the Social Capital Questionnaire, particularly in its measurement of group/network connectivity, and trust and solidarity. Data from 32 respondents was collected on:
- Demographic and economic background – age, location of residence, employment status and occupation, household size, monthly household income (or proportion of household salary on housing rent), and housing type.
- Individual well-being – Cantril’s ladder, aspects of life looking forward to/dreading, and current struggles and worries.
- Interpersonal (community) well-being – frequency of participation in community activities, level of interaction with the public (based on frequency), close friend connections, perceived/anticipated level of help received during times of need, perceived trust of neighbors and public, safety, and daily interaction experience in the local region.
- Correlational indicators – impacts of income on well-being, and housing situation on happiness.
Furthermore, photographic data and building quality information were collected to gauge the quality of housing and infrastructure.
General Results
Imagine a ladder with steps numbered from zero at the bottom to ten at the top. Suppose we say that the top of the ladder represents the best possible life for you and the bottom of the ladder represents the worst possible life for you. If the top step is 10 and the bottom step is 0, on which step of the ladder do you feel you personally stand at the present time?
How would you respond?
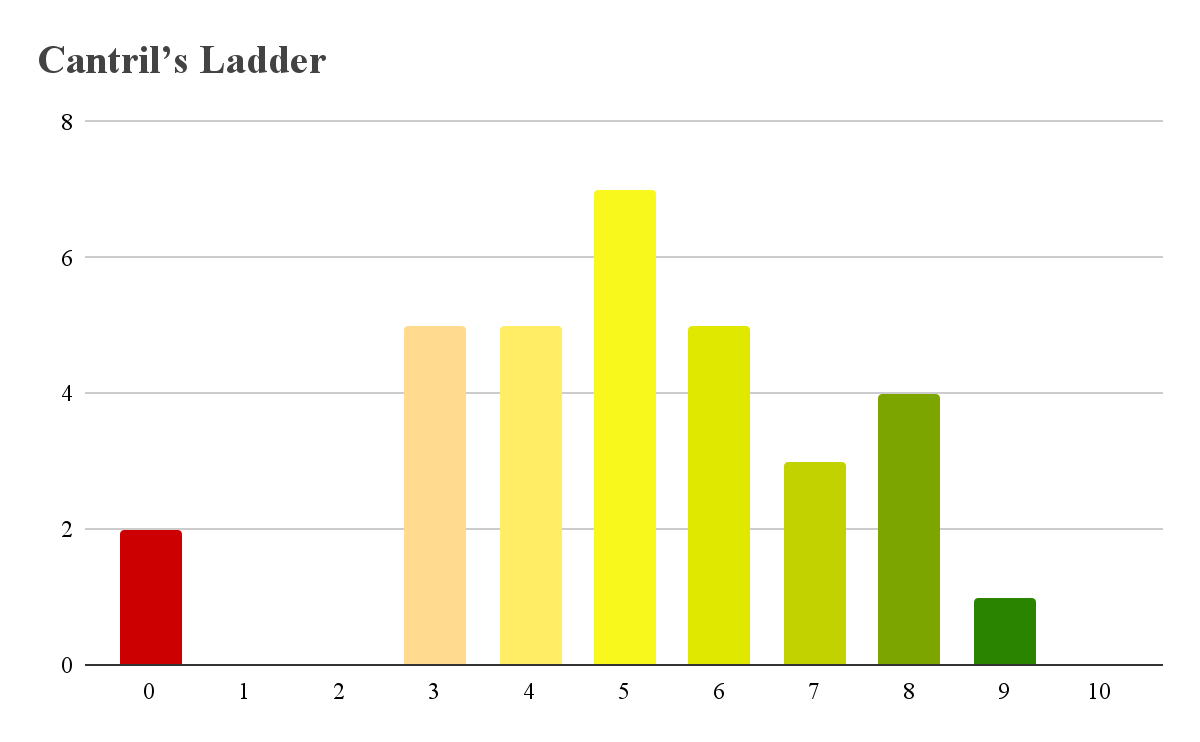
Almost 60% of respondents responded with 5 or below on Cantril’s ladder, with an average of 5.06, lower than the global average life evaluation of 5.5.
Thematic content analysis was performed to find common topics respondents looked forward to and dreaded. Most participants weren’t sure what they looked forward to or dreaded. Of those sure, income, economy, and work-life balance were essential components that dictated participants’ outlook on life.
Furthermore, participation in community activities on the District-wide and Neighborhood-wide scale was extremely low, with most respondents stating they’d never really participate in such activities.
Additionally, perceived trust within Kwun Tong averages 2.97, and trust within the neighborhood averages 3.37. The increase highlights that participants felt closer to people living close to them. Nonetheless, responses accentuate the lack of trust within communities in the following question: “If you suddenly had to go away for a day or two, how many neighbors could you ask to take care of your children or household?” We found the average number of neighbors trusted in extreme cases was 0.31, indicating that citizens didn’t trust anyone other than immediate family for help during dire situations.
Cantril’s ladder data from (“World Happiness”).
Housing and Infrastructure Maintenance and Quality
We found that housing was in general well-maintained, with newer public housing estates particularly very well-maintained. The best-rated estates in terms of appearance were Kai Tai Court (1983, HOS) and Choi Tak Estate (2010, Public Rental), followed by Lower Ngau Tau Estate (1967, Public Rental), Telford Gardens (1980-1982, Private), Amoy Gardens (1981-1987, Private), and Richland Gardens (1985, HOS).
Figures in left-to-right, top-to-bottom order: Kai Tai Court, Kai Yip Estate (maintenance and
visible tile degradation), Kai Yip Estate (construction of new buildings), Choi Tak Estate,
Kwun Tong Road (building construction), Ngau Tau Kok Lower Estate, Telford Gardens, Amoy Gardens. 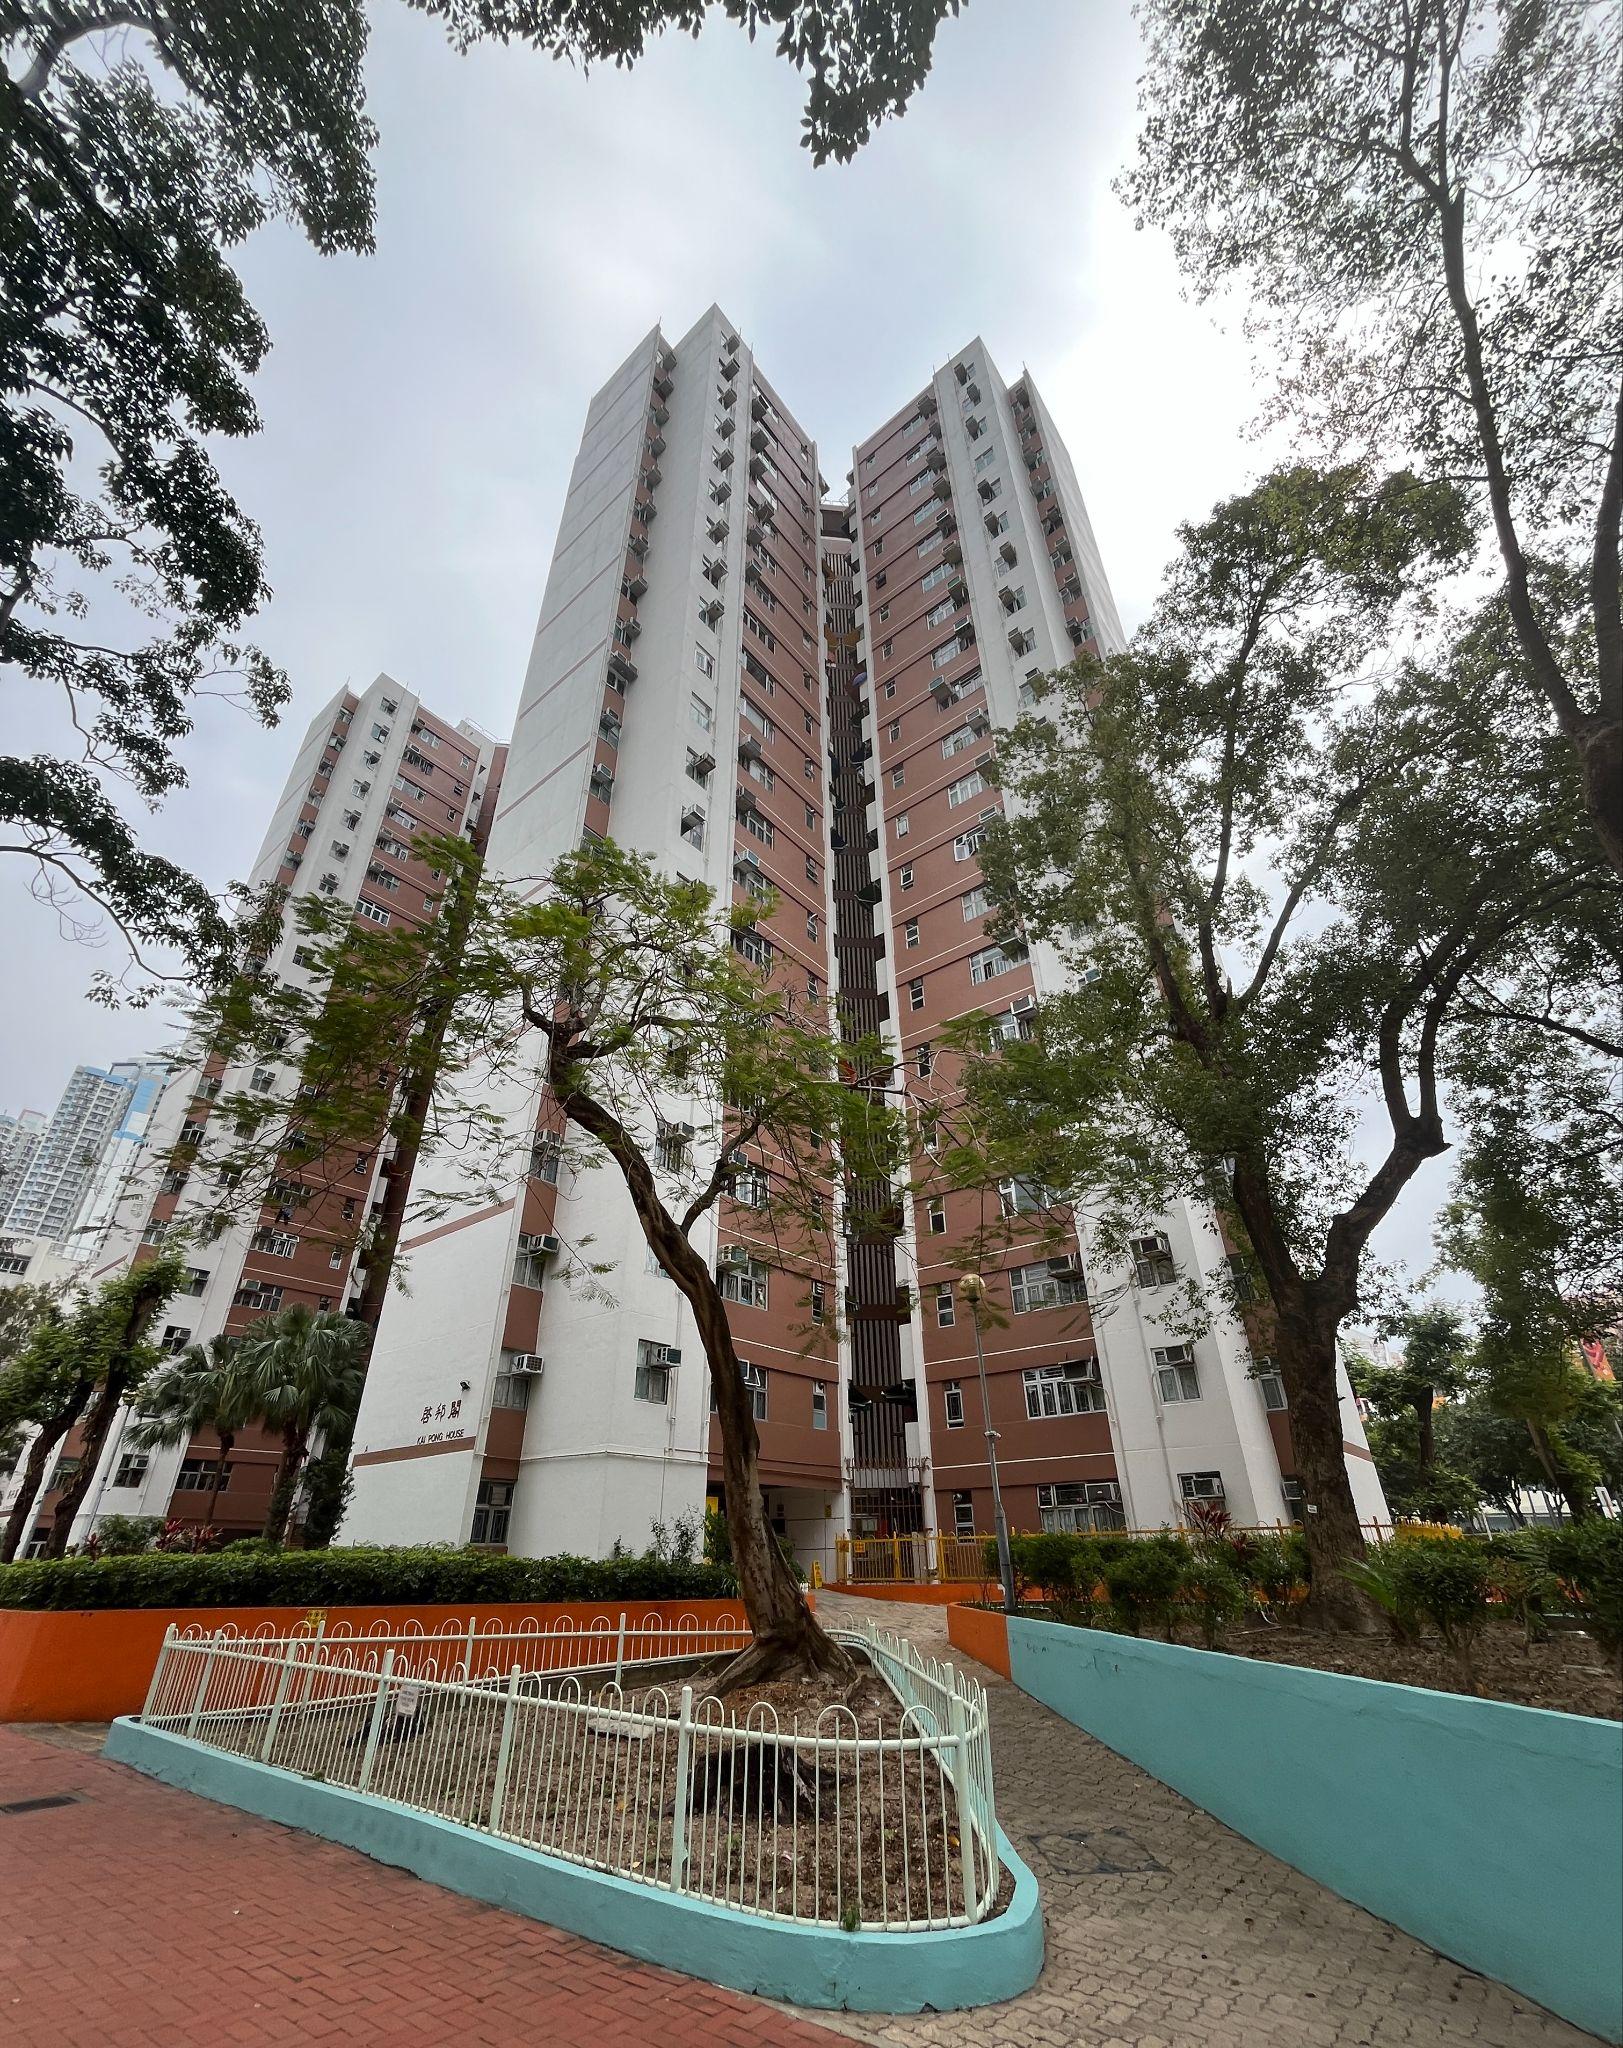
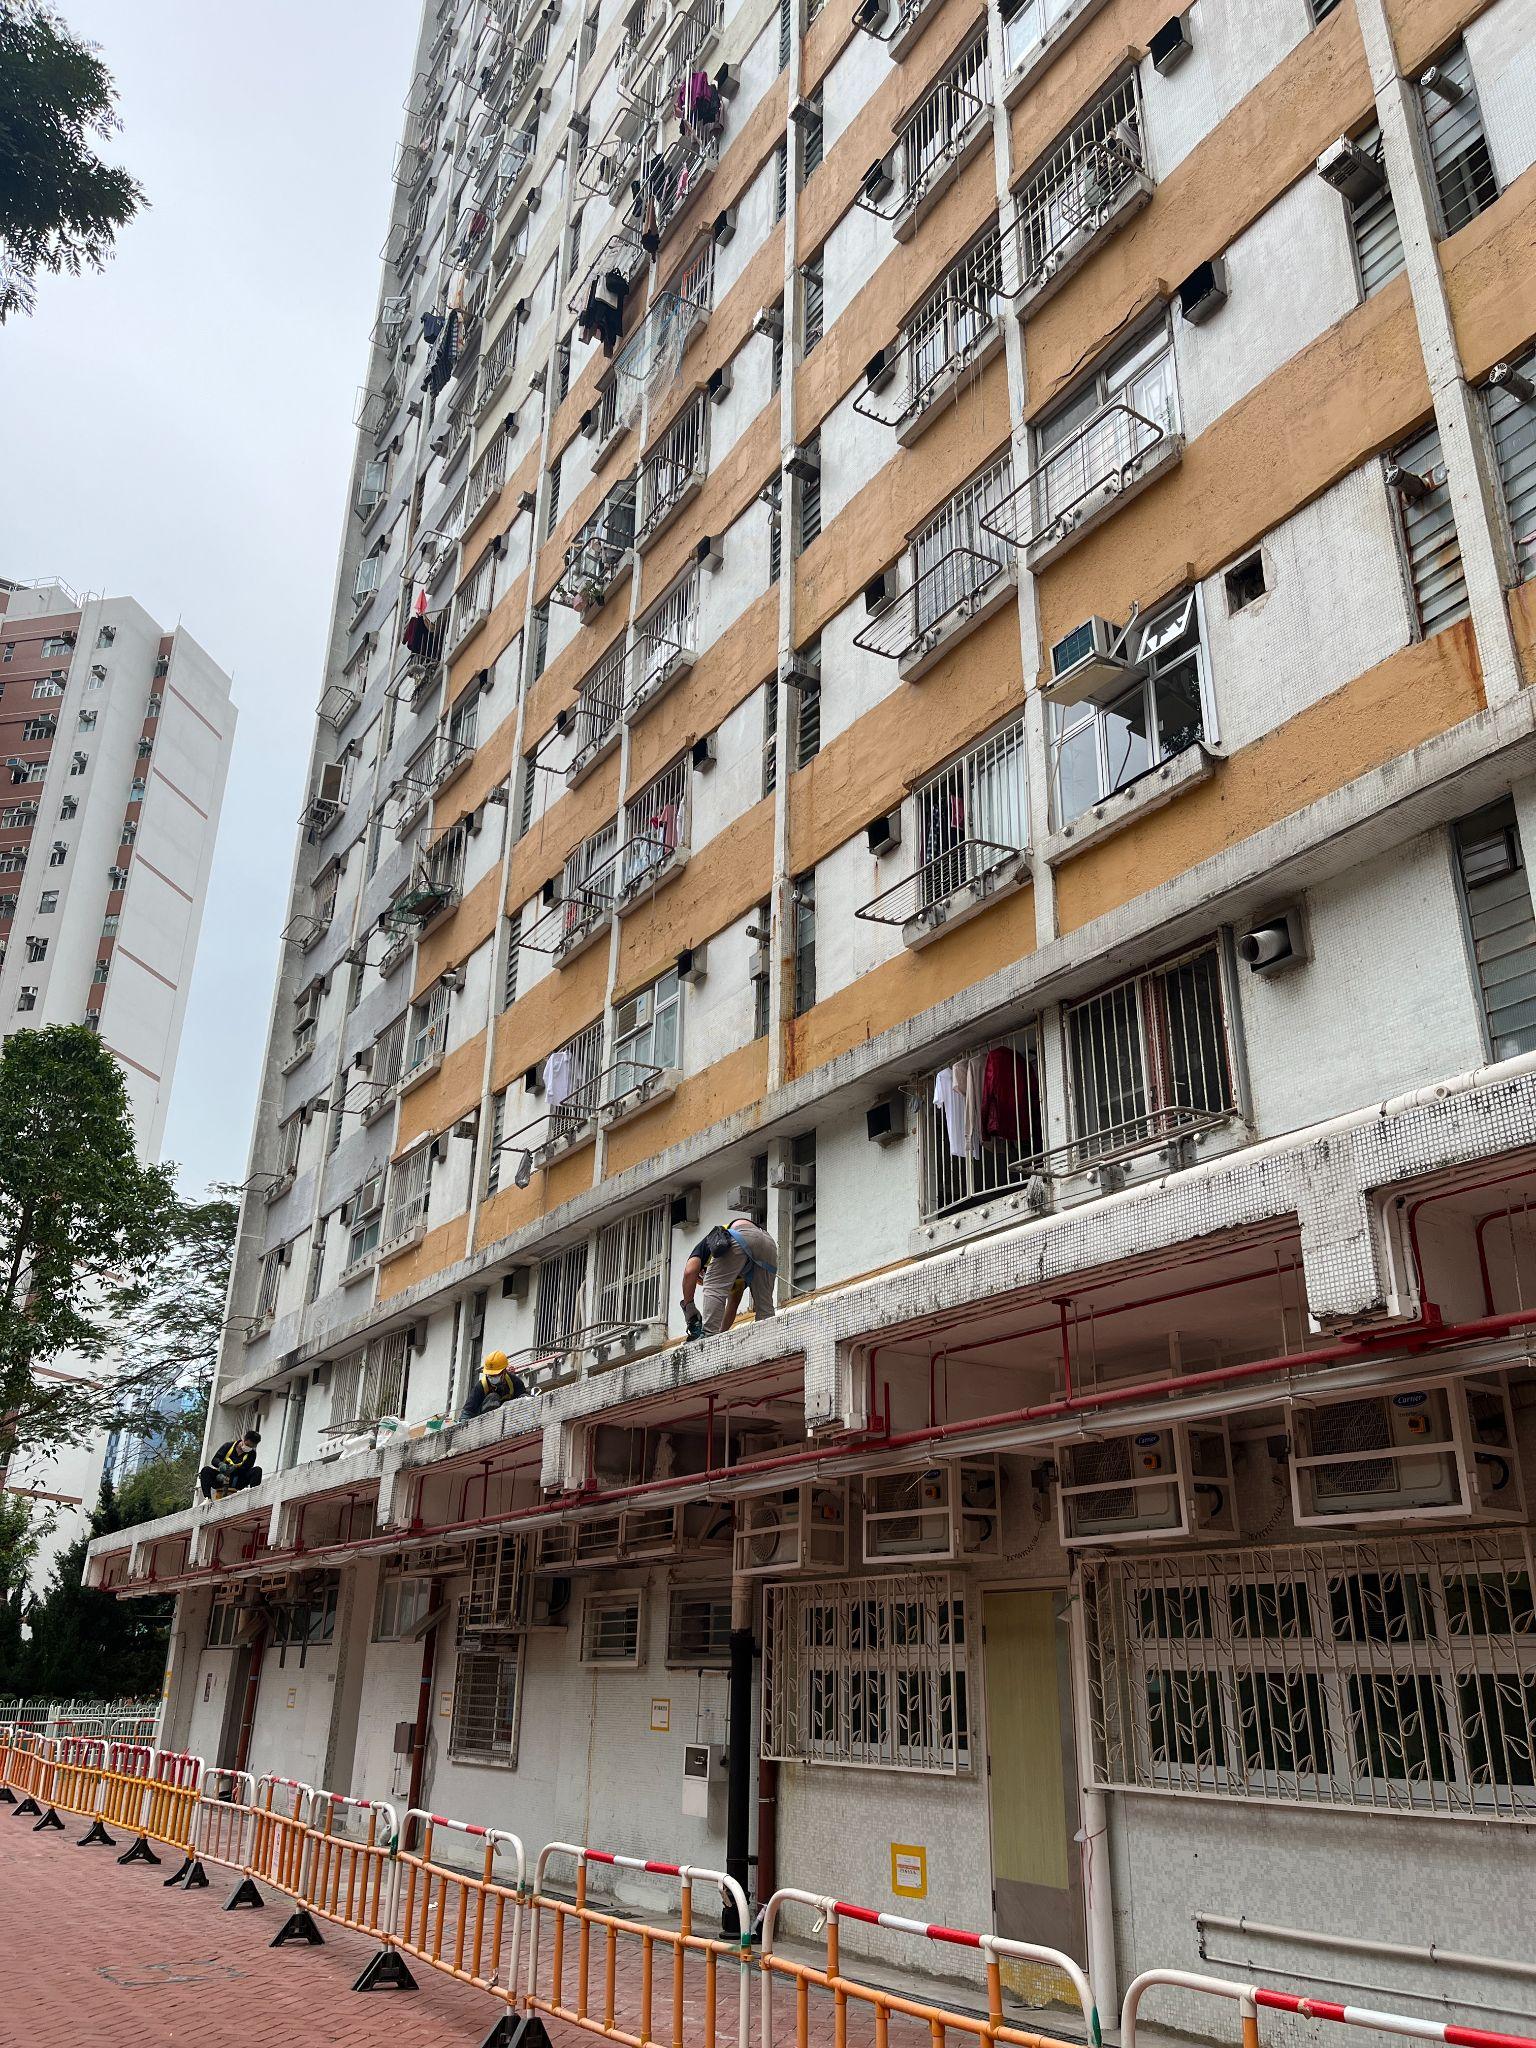
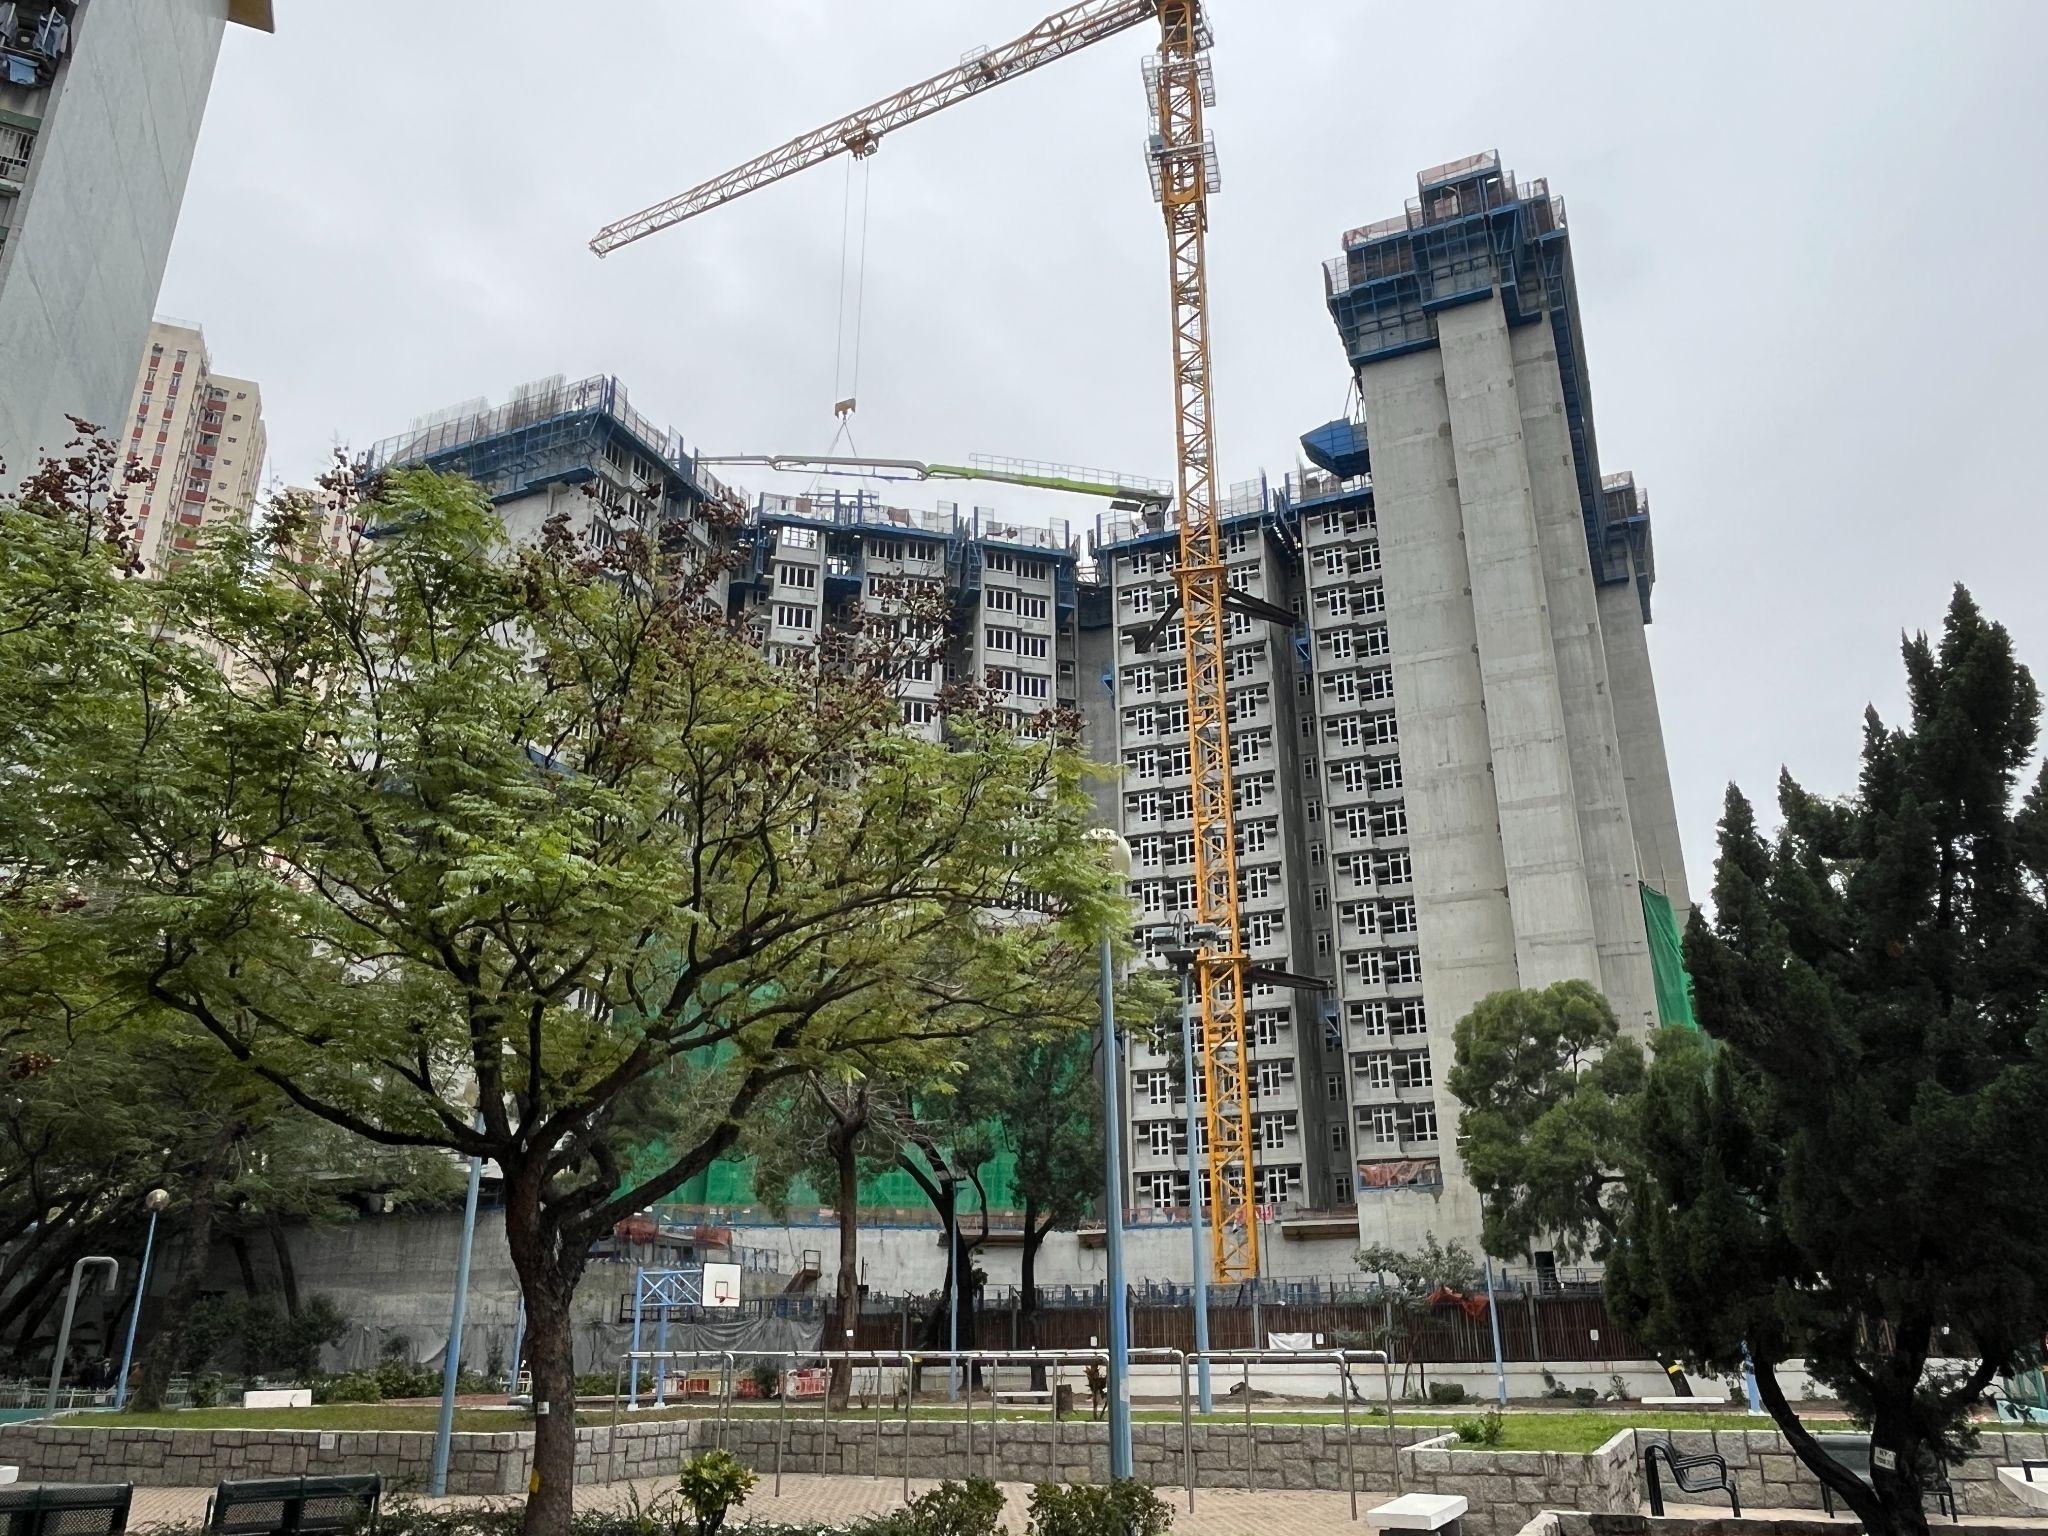
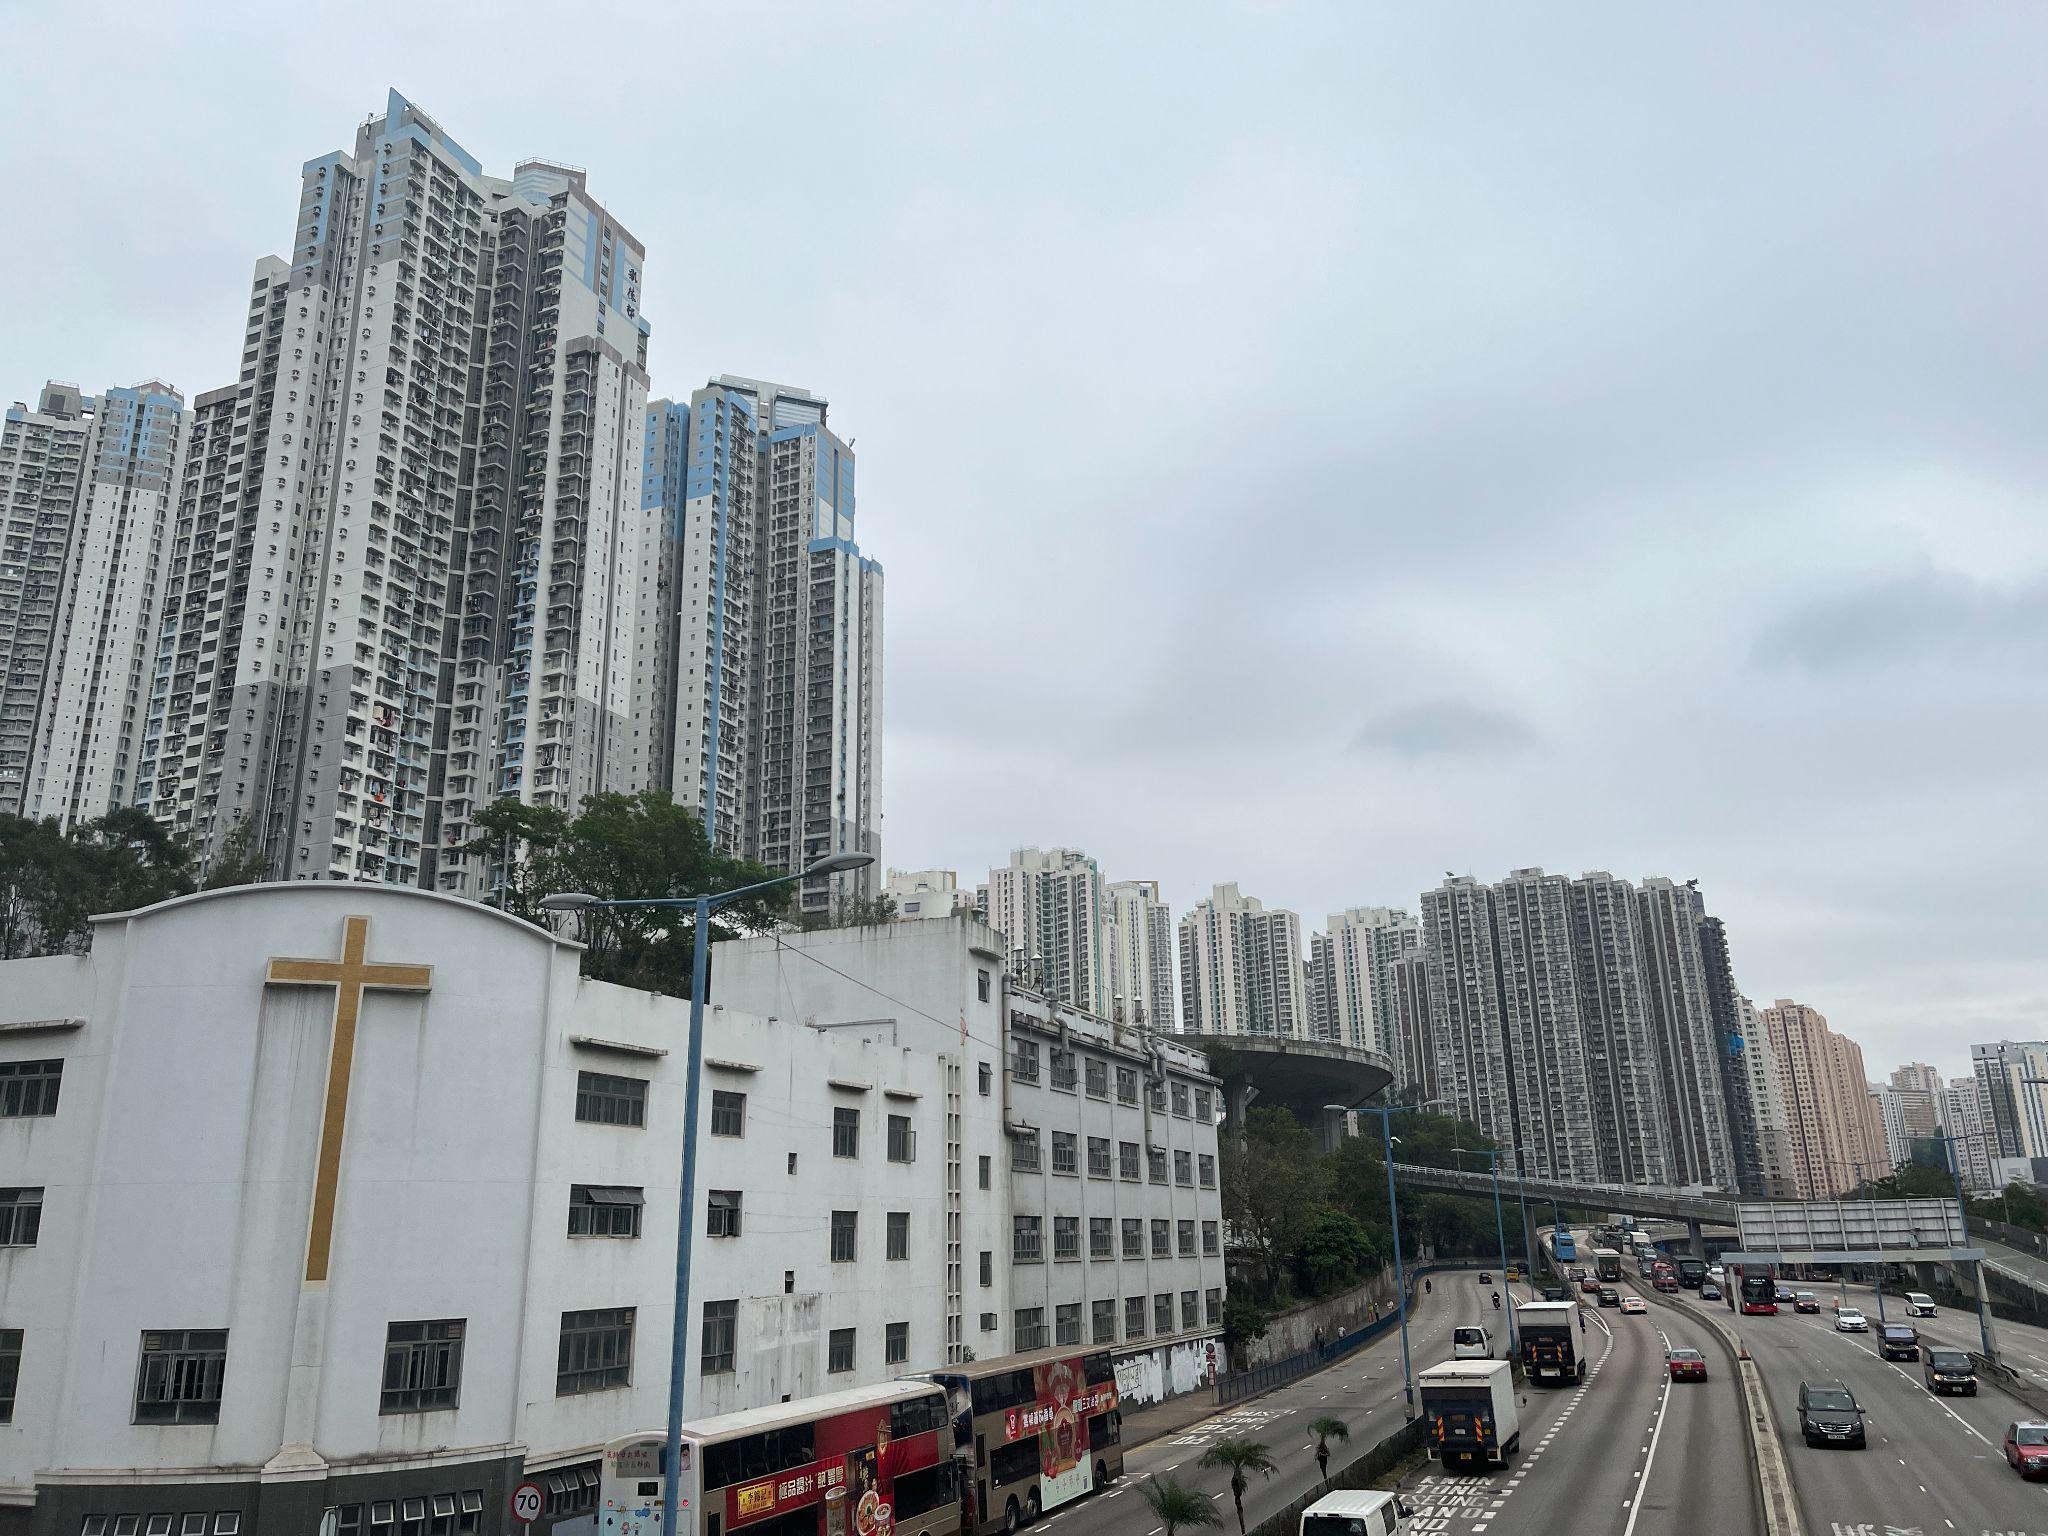
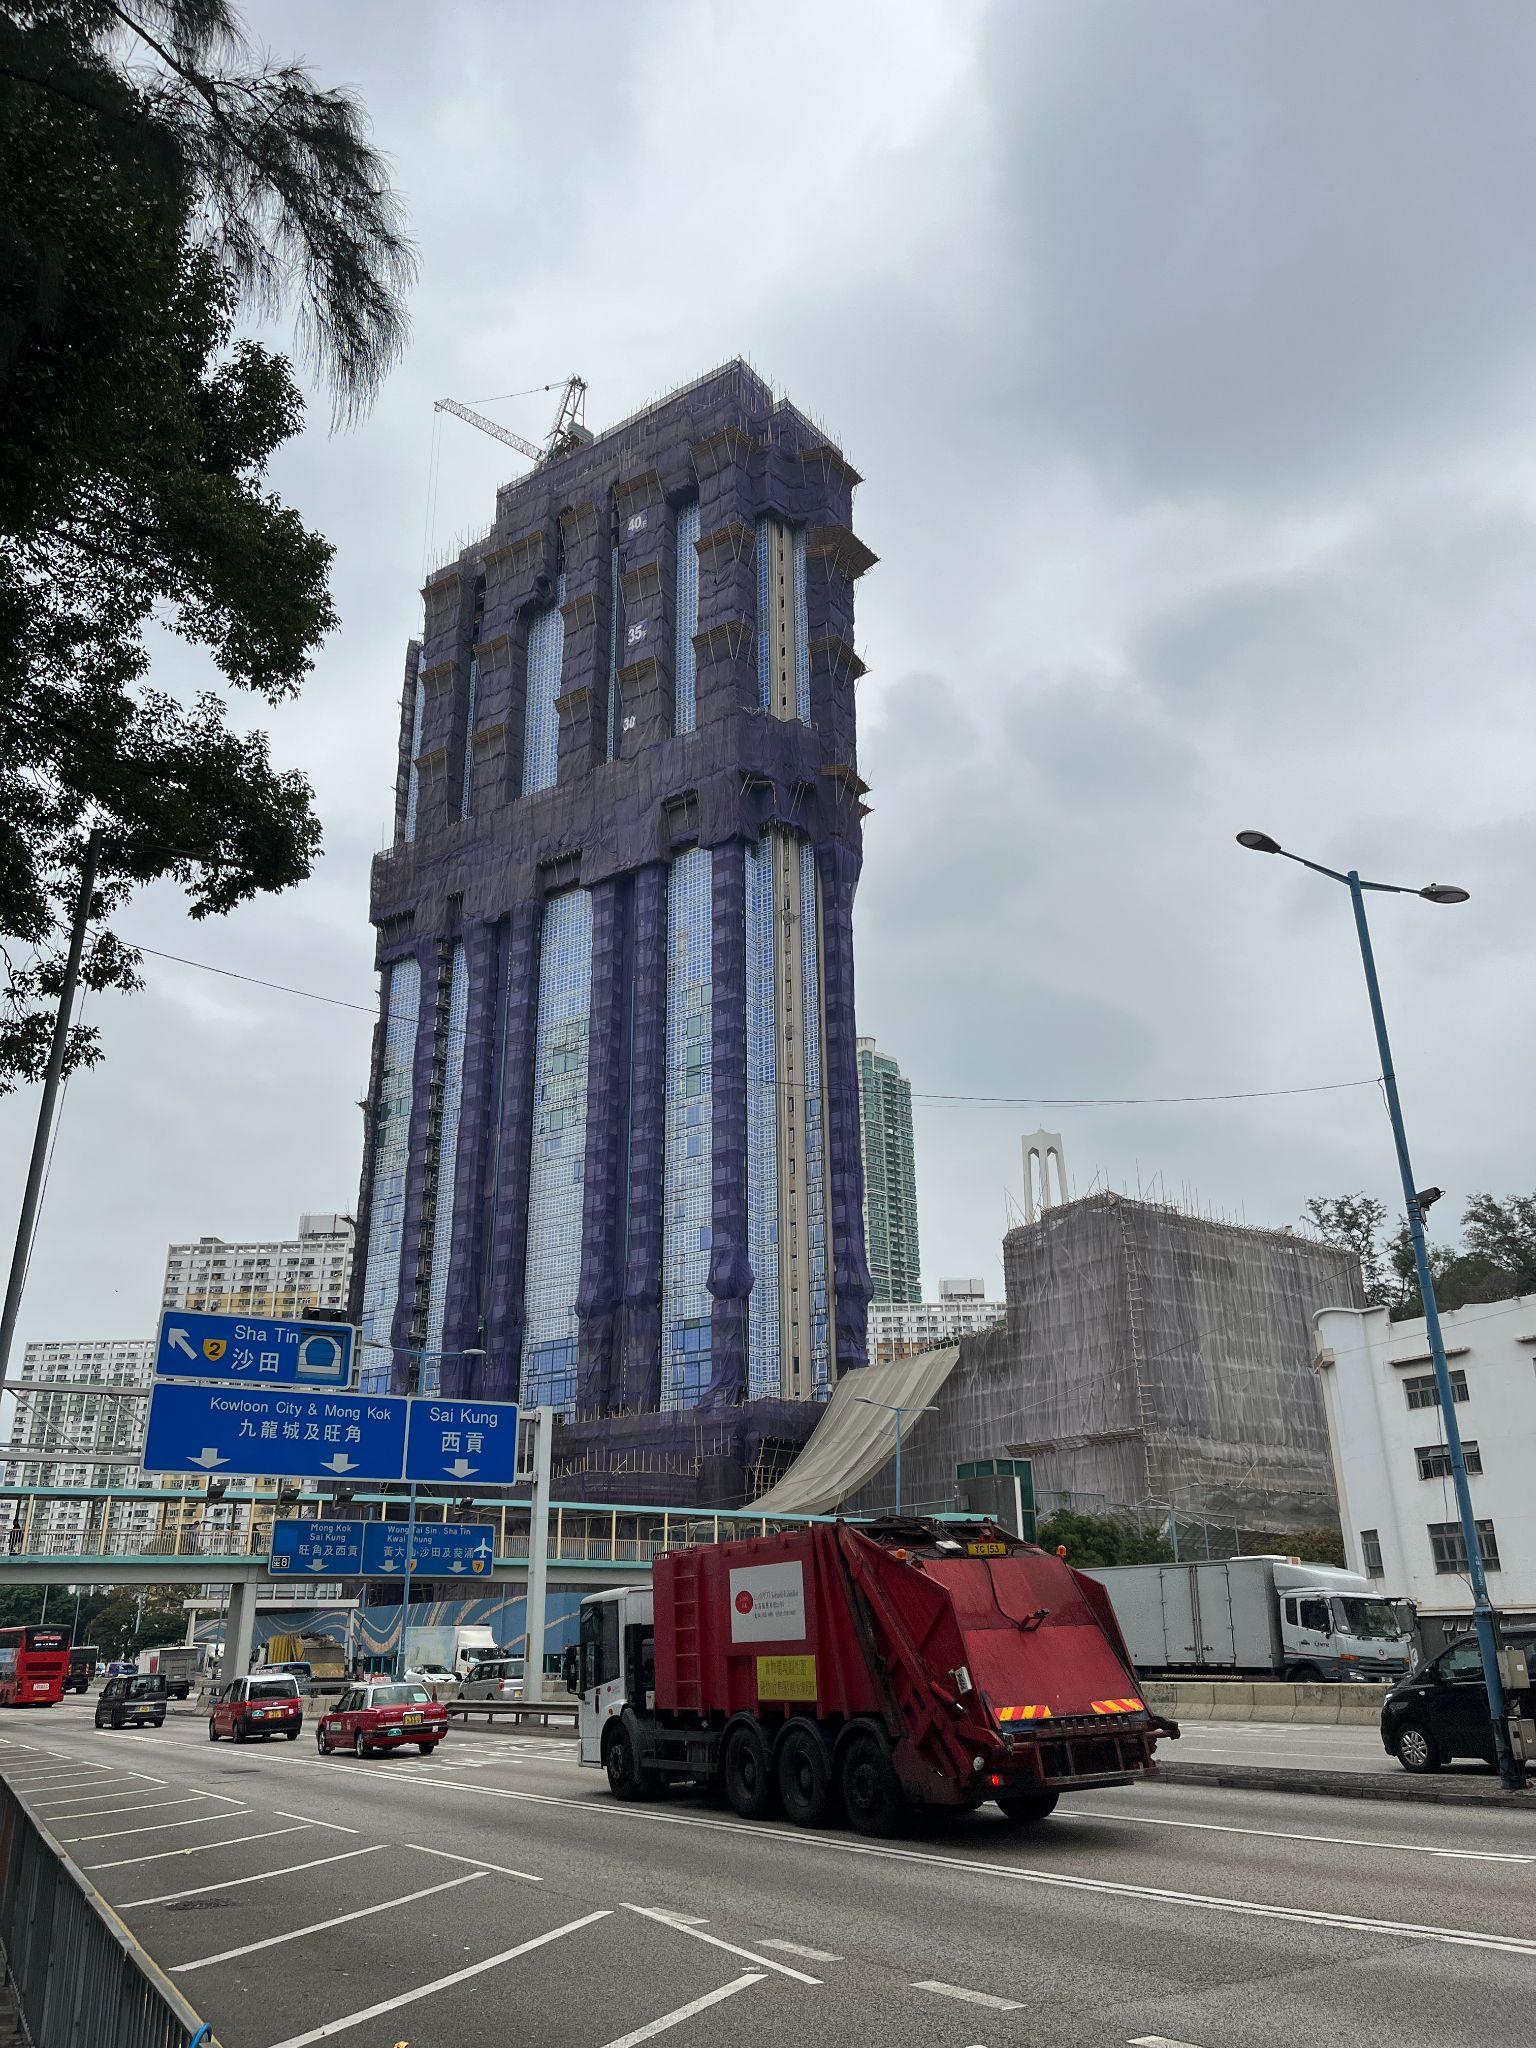
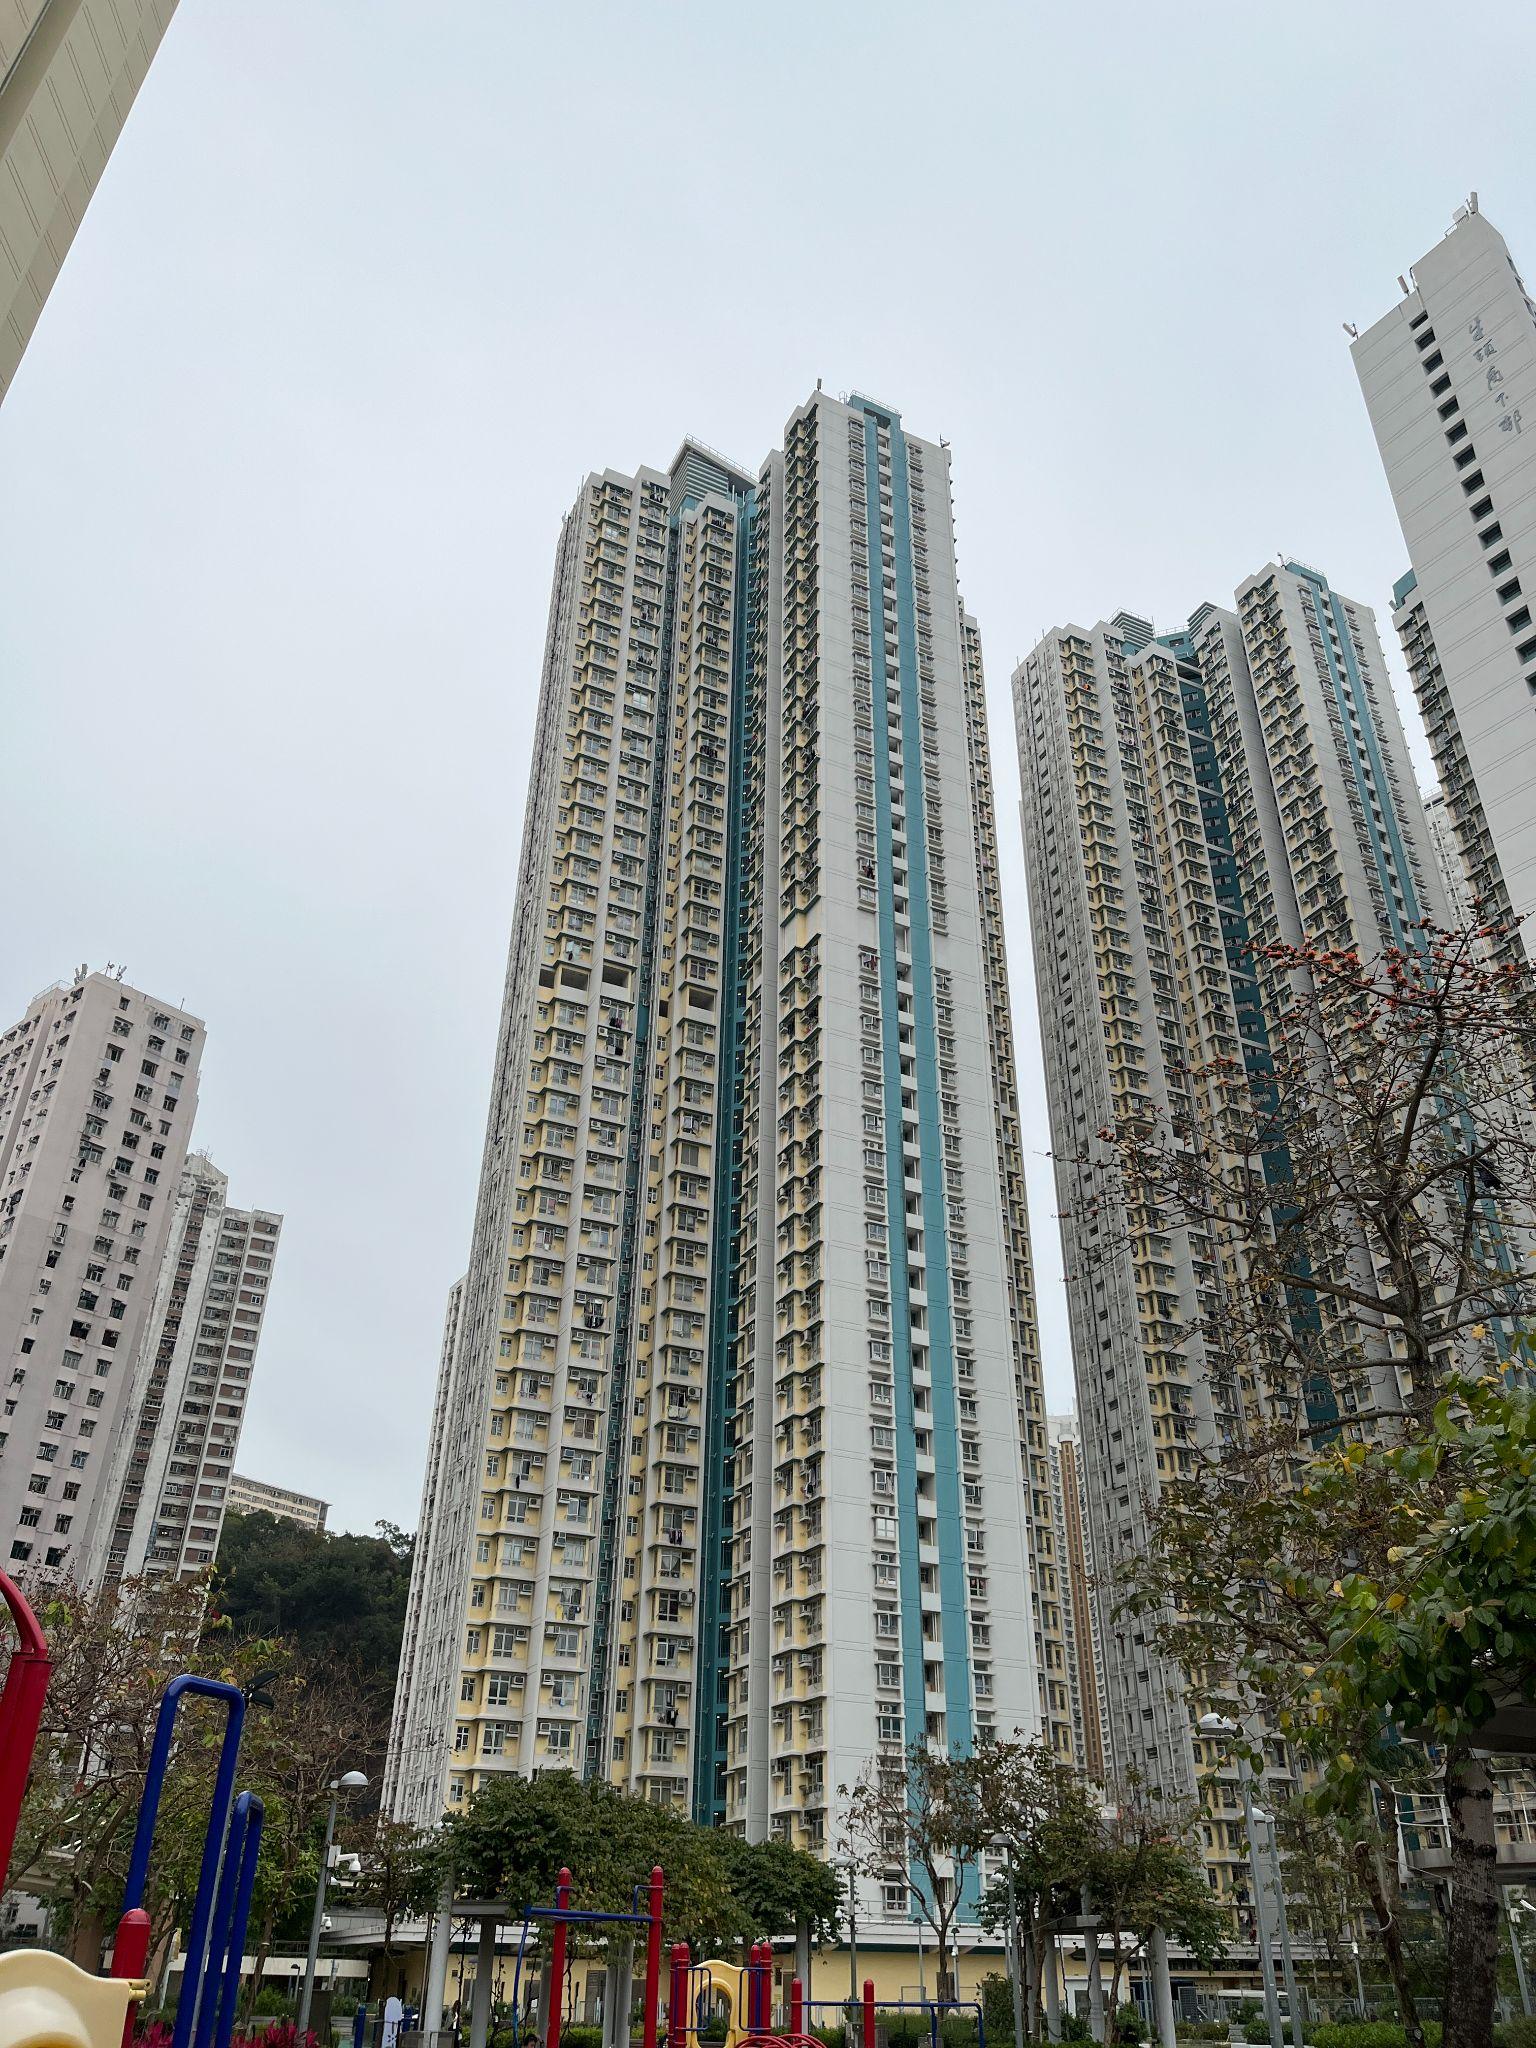
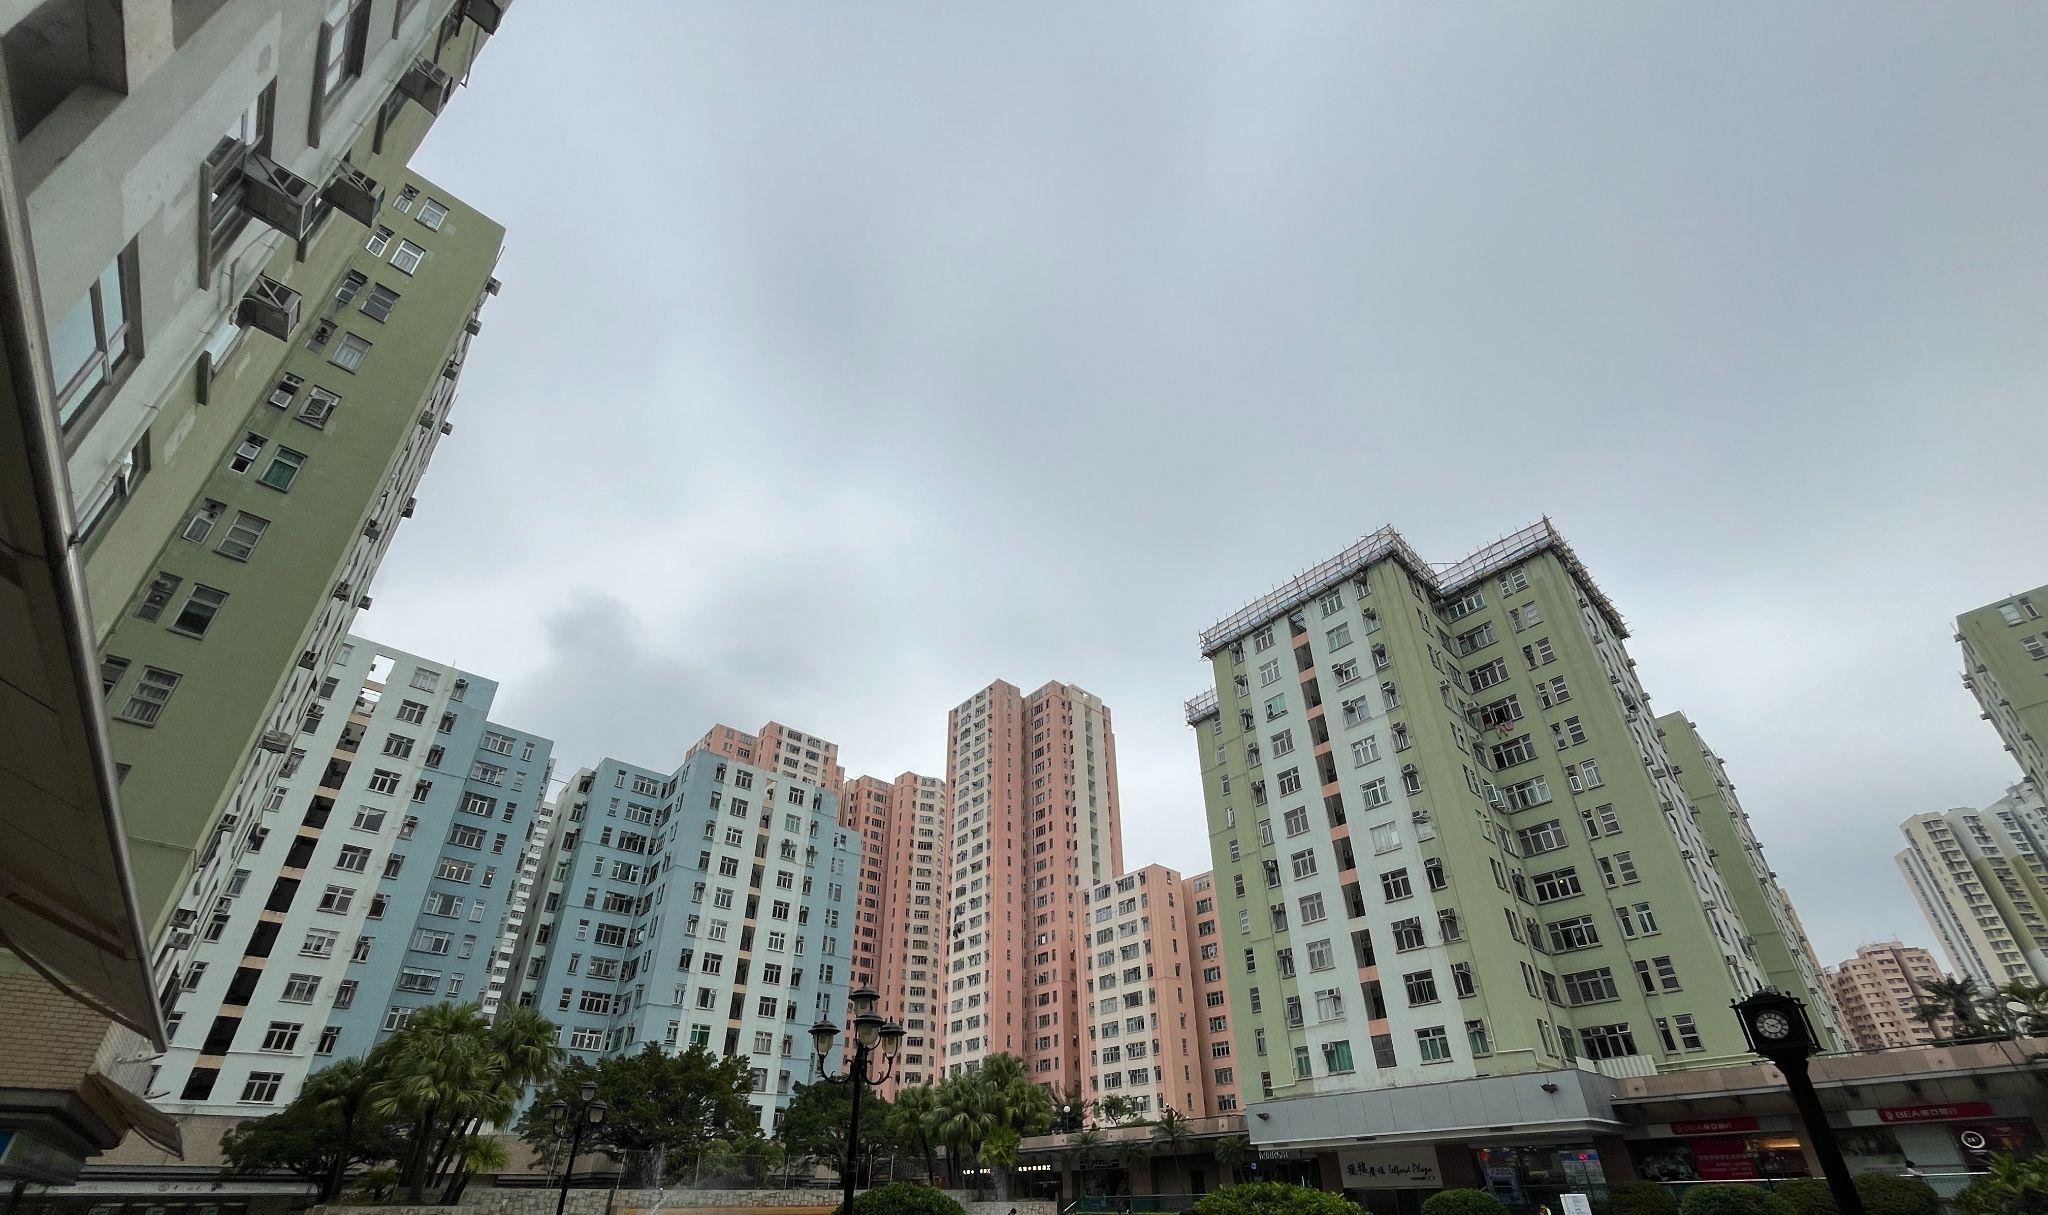
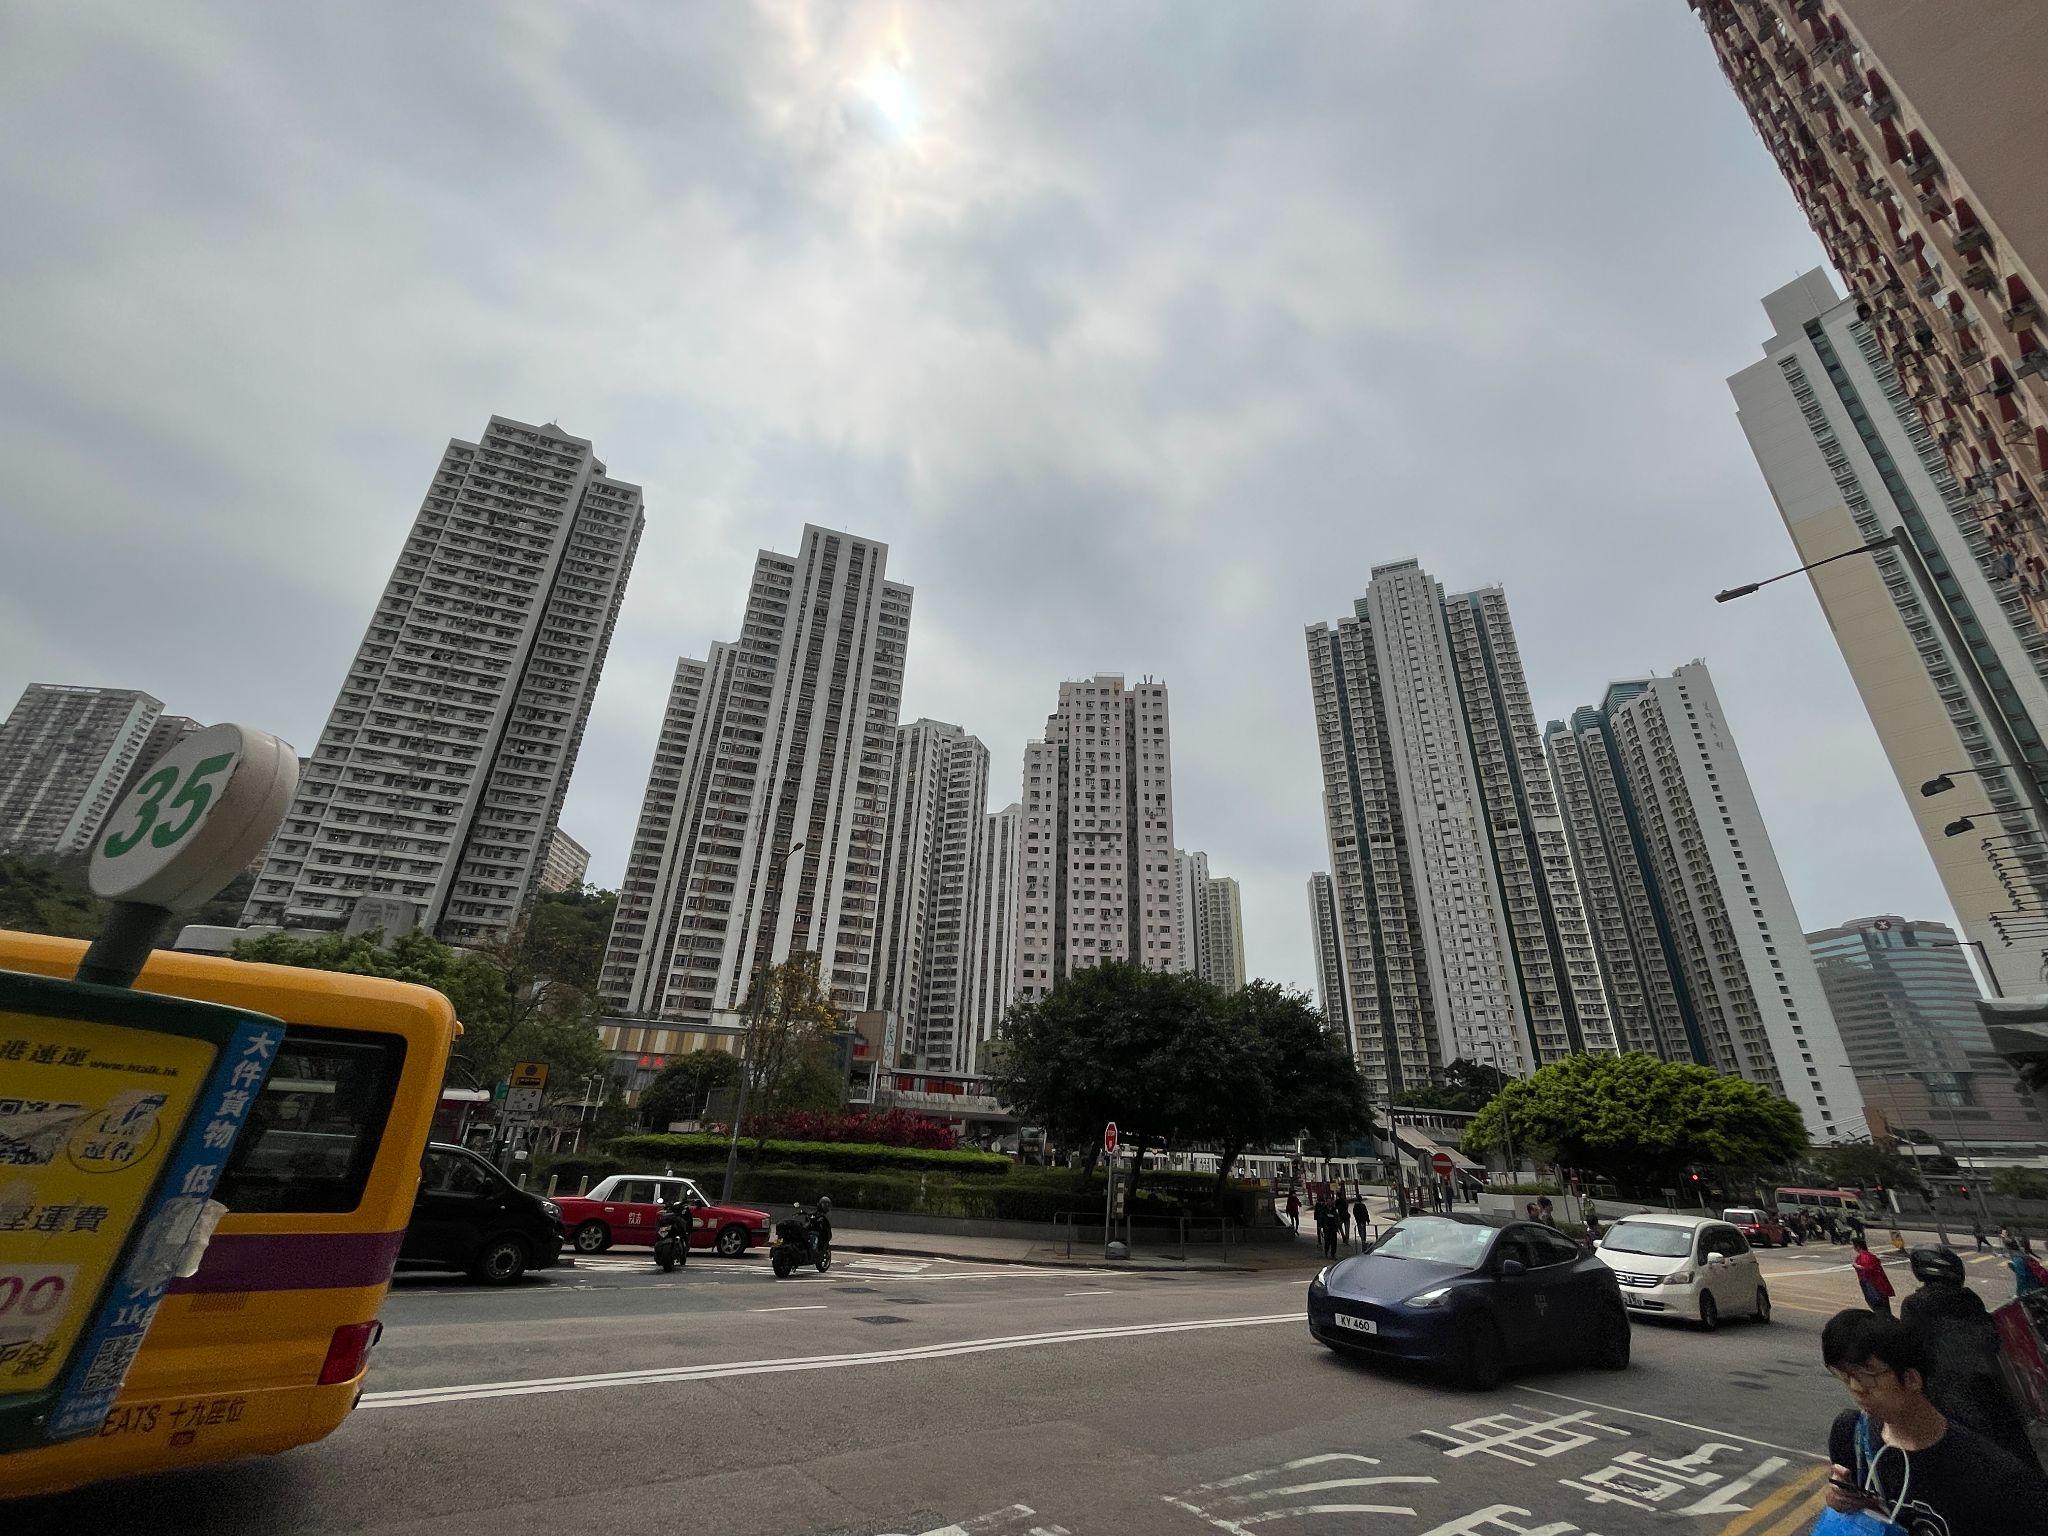
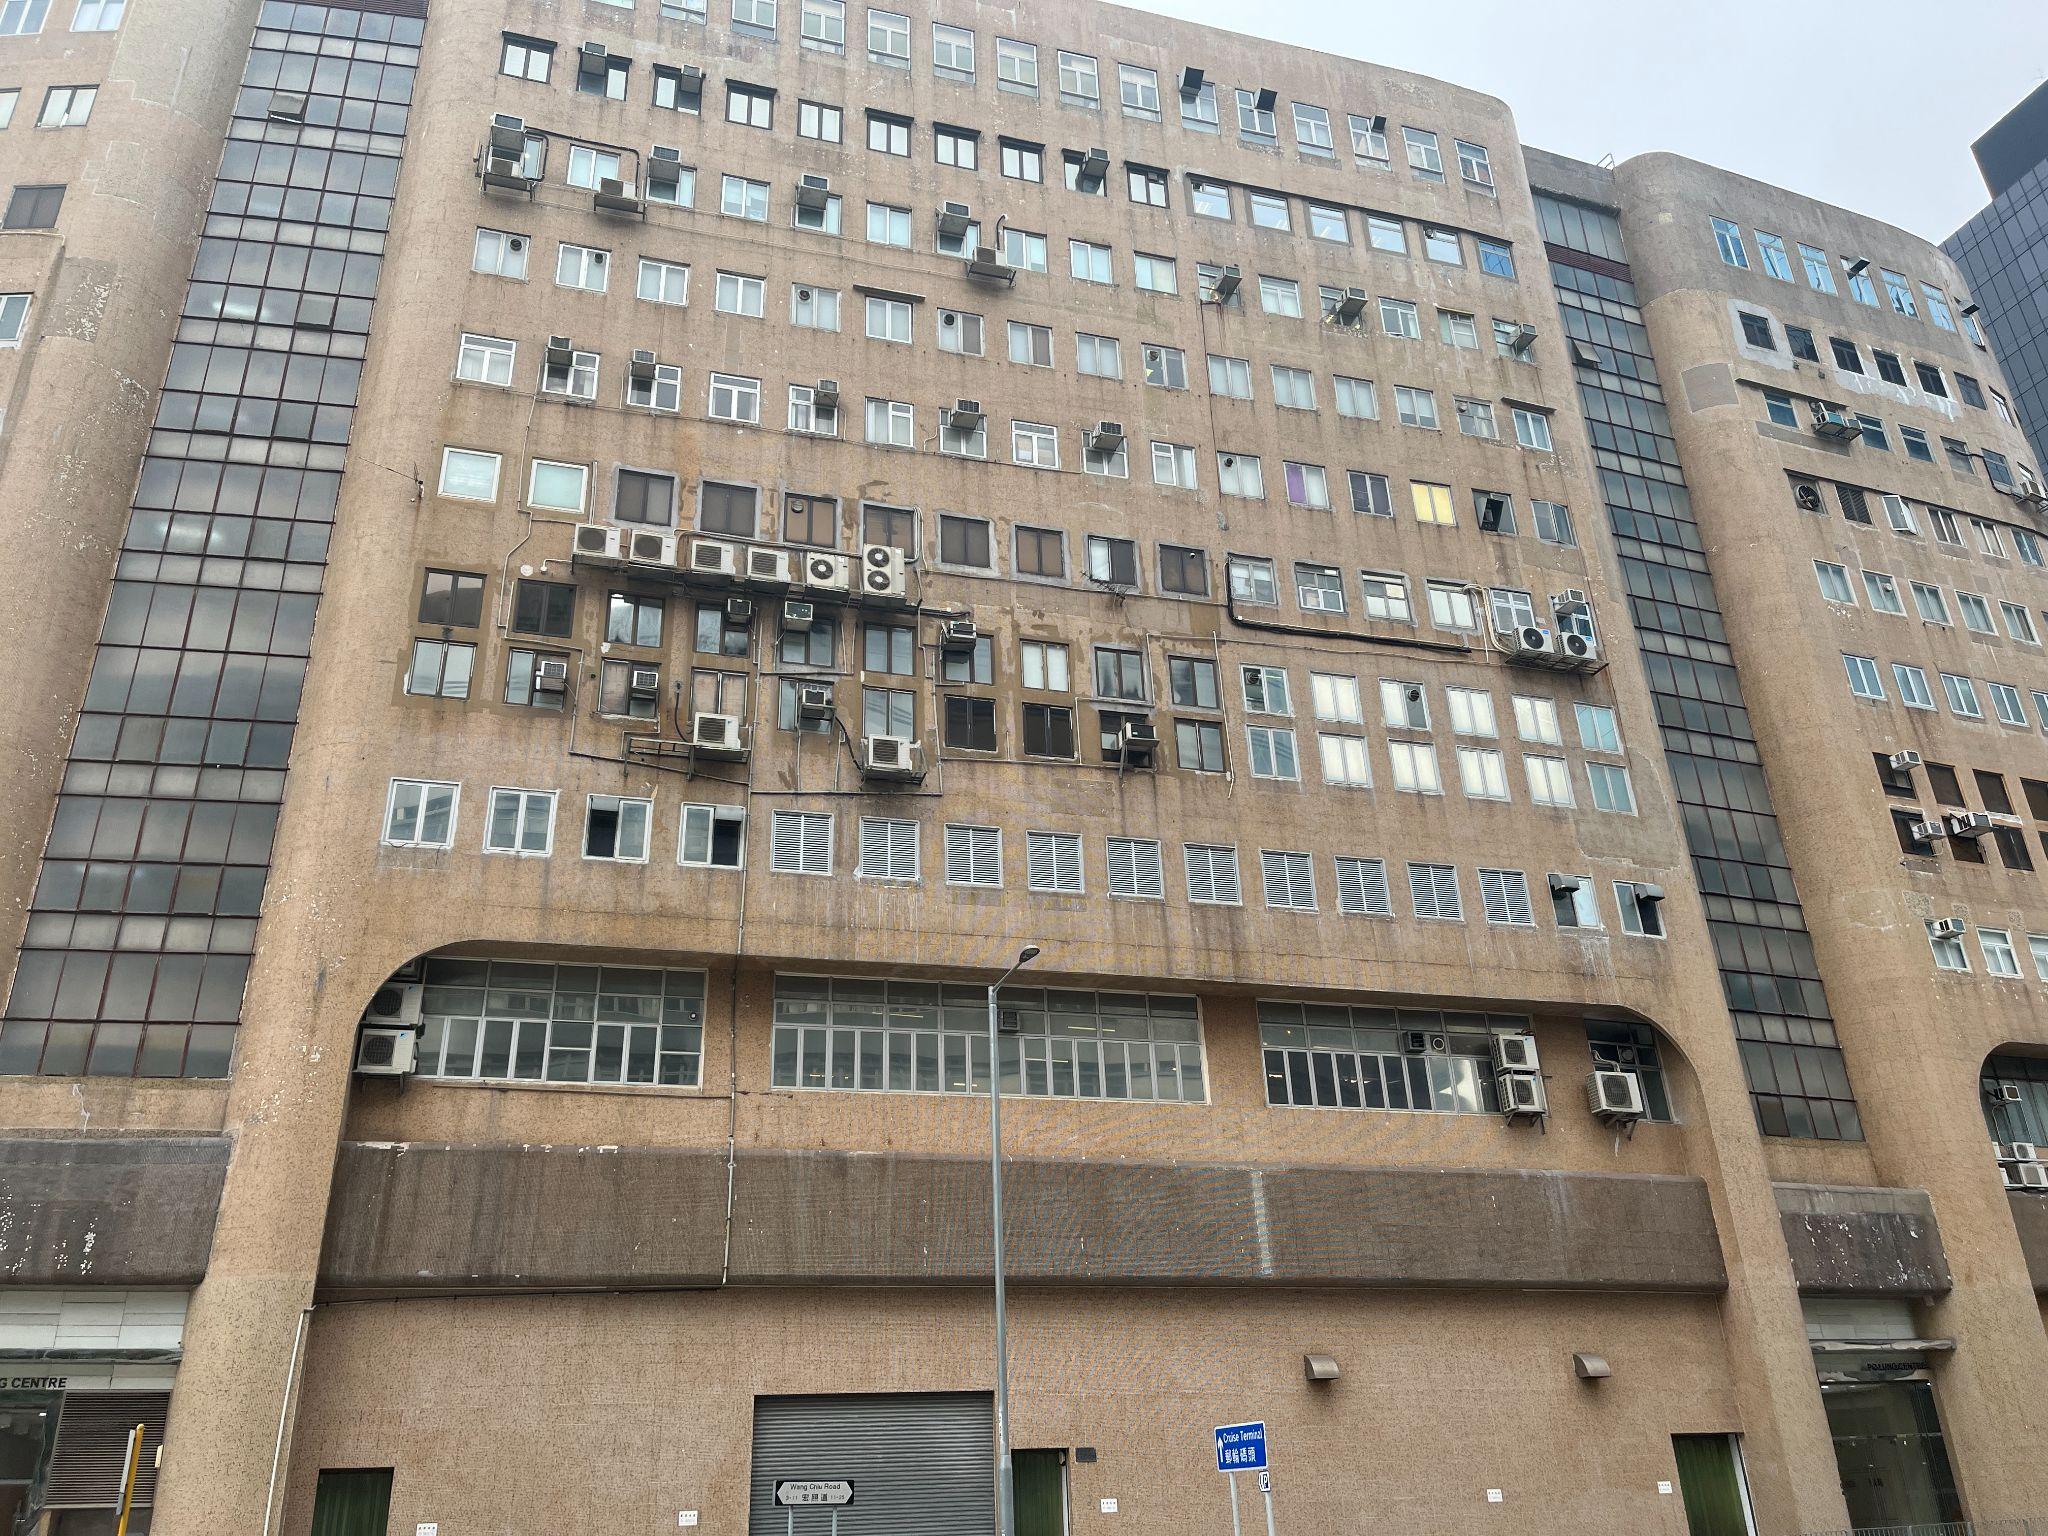
However, we found infrastructure maintenance left much to be desired…
Po Lung Center – would have likely looked the same 20 years ago.
Graffiti under passageways.
…but nonetheless the aging infrastructure serves as a remnant and reminiscent view of history.
Composite buildings and newer office/commercial buildings co-exist along Wang Chiu Street.
Composite buildings with haphazardly positioned air-conditioning units on Wang Chiu Street.
A shoe-repair and locksmith workshop and grocery store continue to operate under the aging sign of a shut-down wooden furniture and materials company called “成輝建築材料公司” on Wang Chiu Street.
Modern ‘sitting-out areas’ line the narrow spaces between two aging buildings near Wang Hoi Road.
Correlational Results
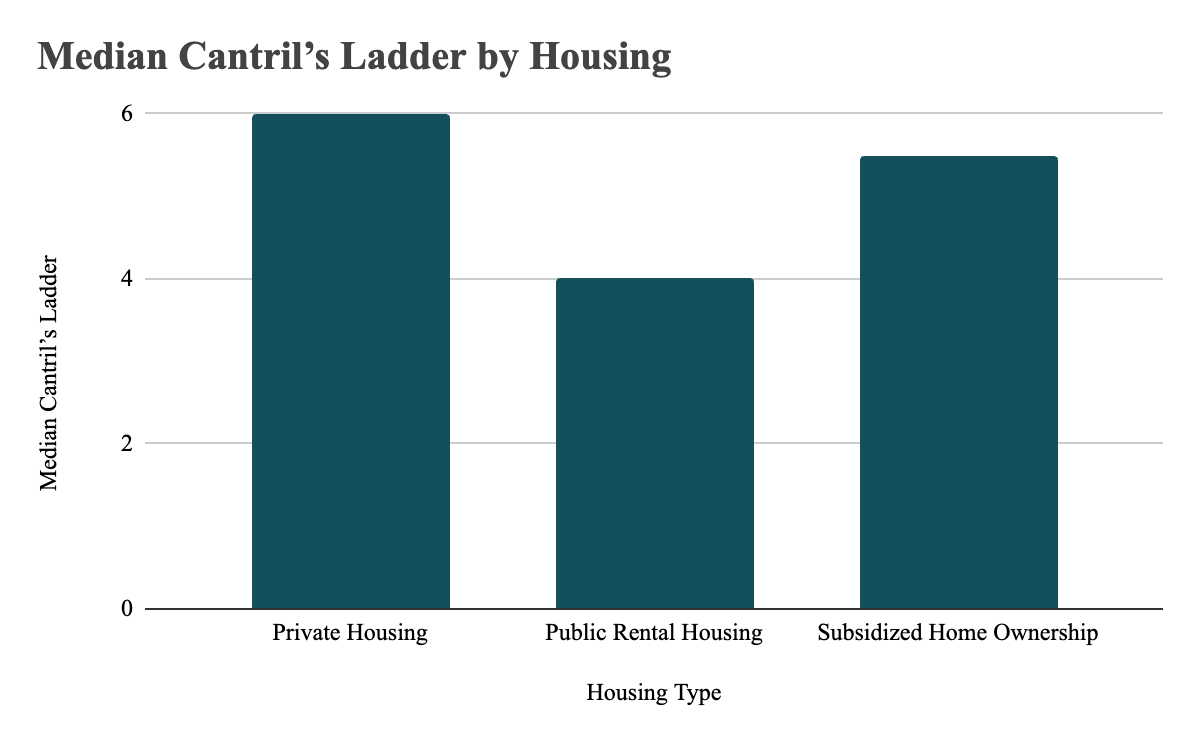
Next, we calculated medians for Cantril’s ladder ratings by housing type, finding that people tended to be happier in private and subsidized home ownership public housing compared to public rental housing, suggesting that housing characteristics (e.g., value and size) have an impact on personal well-being.
Furthermore, the average number of close friends was found to be higher for private housing residents, indicating that housing affected interpersonal well-being.
Residents under the Subsidized Home Ownership Scheme (HOS) had the most favorable views on the effectivity of government housing policies, but it is notable that on average, participants rated government housing policy effectivity at 1.6/5, highlighting the need for more effective measures to be taken.
Public housing residents felt that income was a noticeable factor in personal well-being. Private housing residents also had the highest rating for daily interaction experience compared to public housing residents.
Monthly rent was calculated based on the proportion of household income spent on housing and the monthly housing income bracket indicated by participants. Plotting monthly rent against participants’ perception on the effect of housing situation on happiness, we find that there is a strong negative correlation, indicating that as monthly rent increased, the importance of housing situation on happiness decreased. This result can be interpreted as residents who can afford more expensive housing attribute happiness to factors outside of housing, conversely implying that residents who live in cheap housing find that their living situation significantly impacts their well-being.
Similarly, we find a moderate positive correlation between Cantril’s Ladder and Monthly Rent, implying that residents that are able to afford more expensive housing tended to be happier with their position in life.
Individual Spotlight
Returning to the qualitative responses, we identified a few individuals who gave unique insights into influences on personal well-being…
In particular:
Living through day-to-day-life, finding the meaning of life.
Individual #1
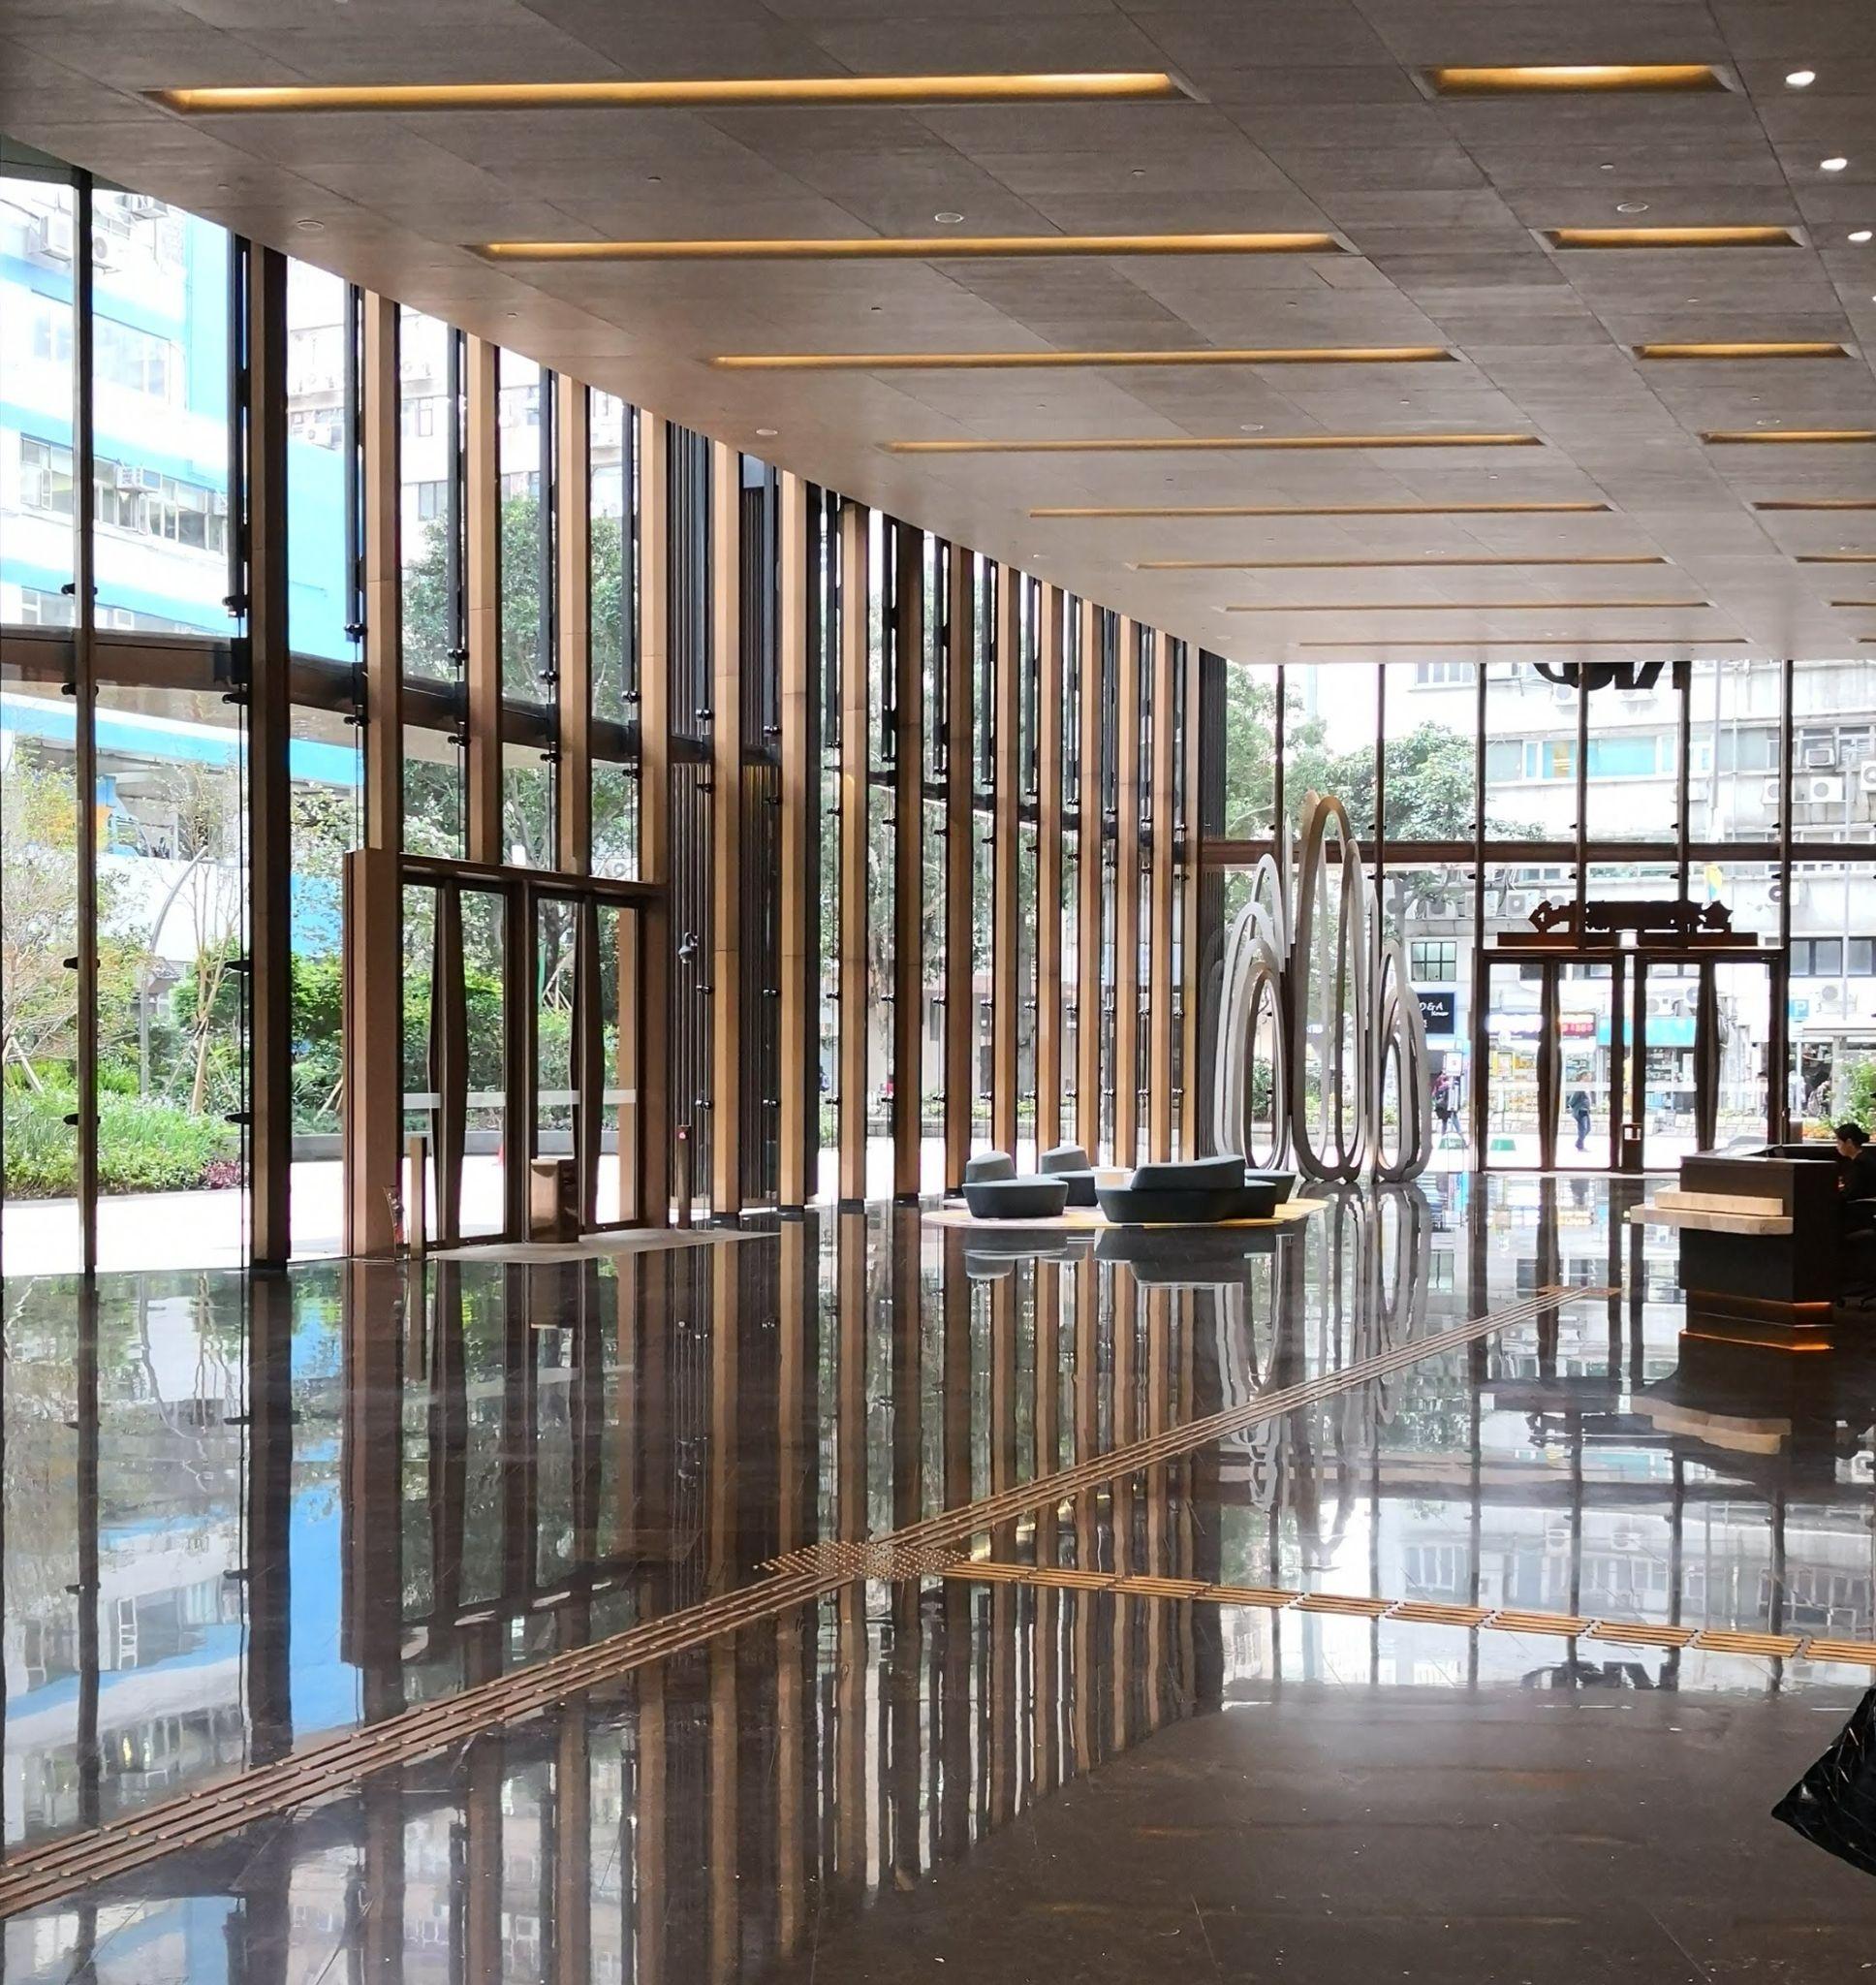 Kingston International Center, image from (兄弟中港). Working as a receptionist at the Kingston International Center, she welcomed members of the public and
answered others’ queries. Despite having an above-average household income at $50,000-100,000 and relative
satisfaction with her place in life (7/10), this individual struggled with finding purpose in life.
Individual #2
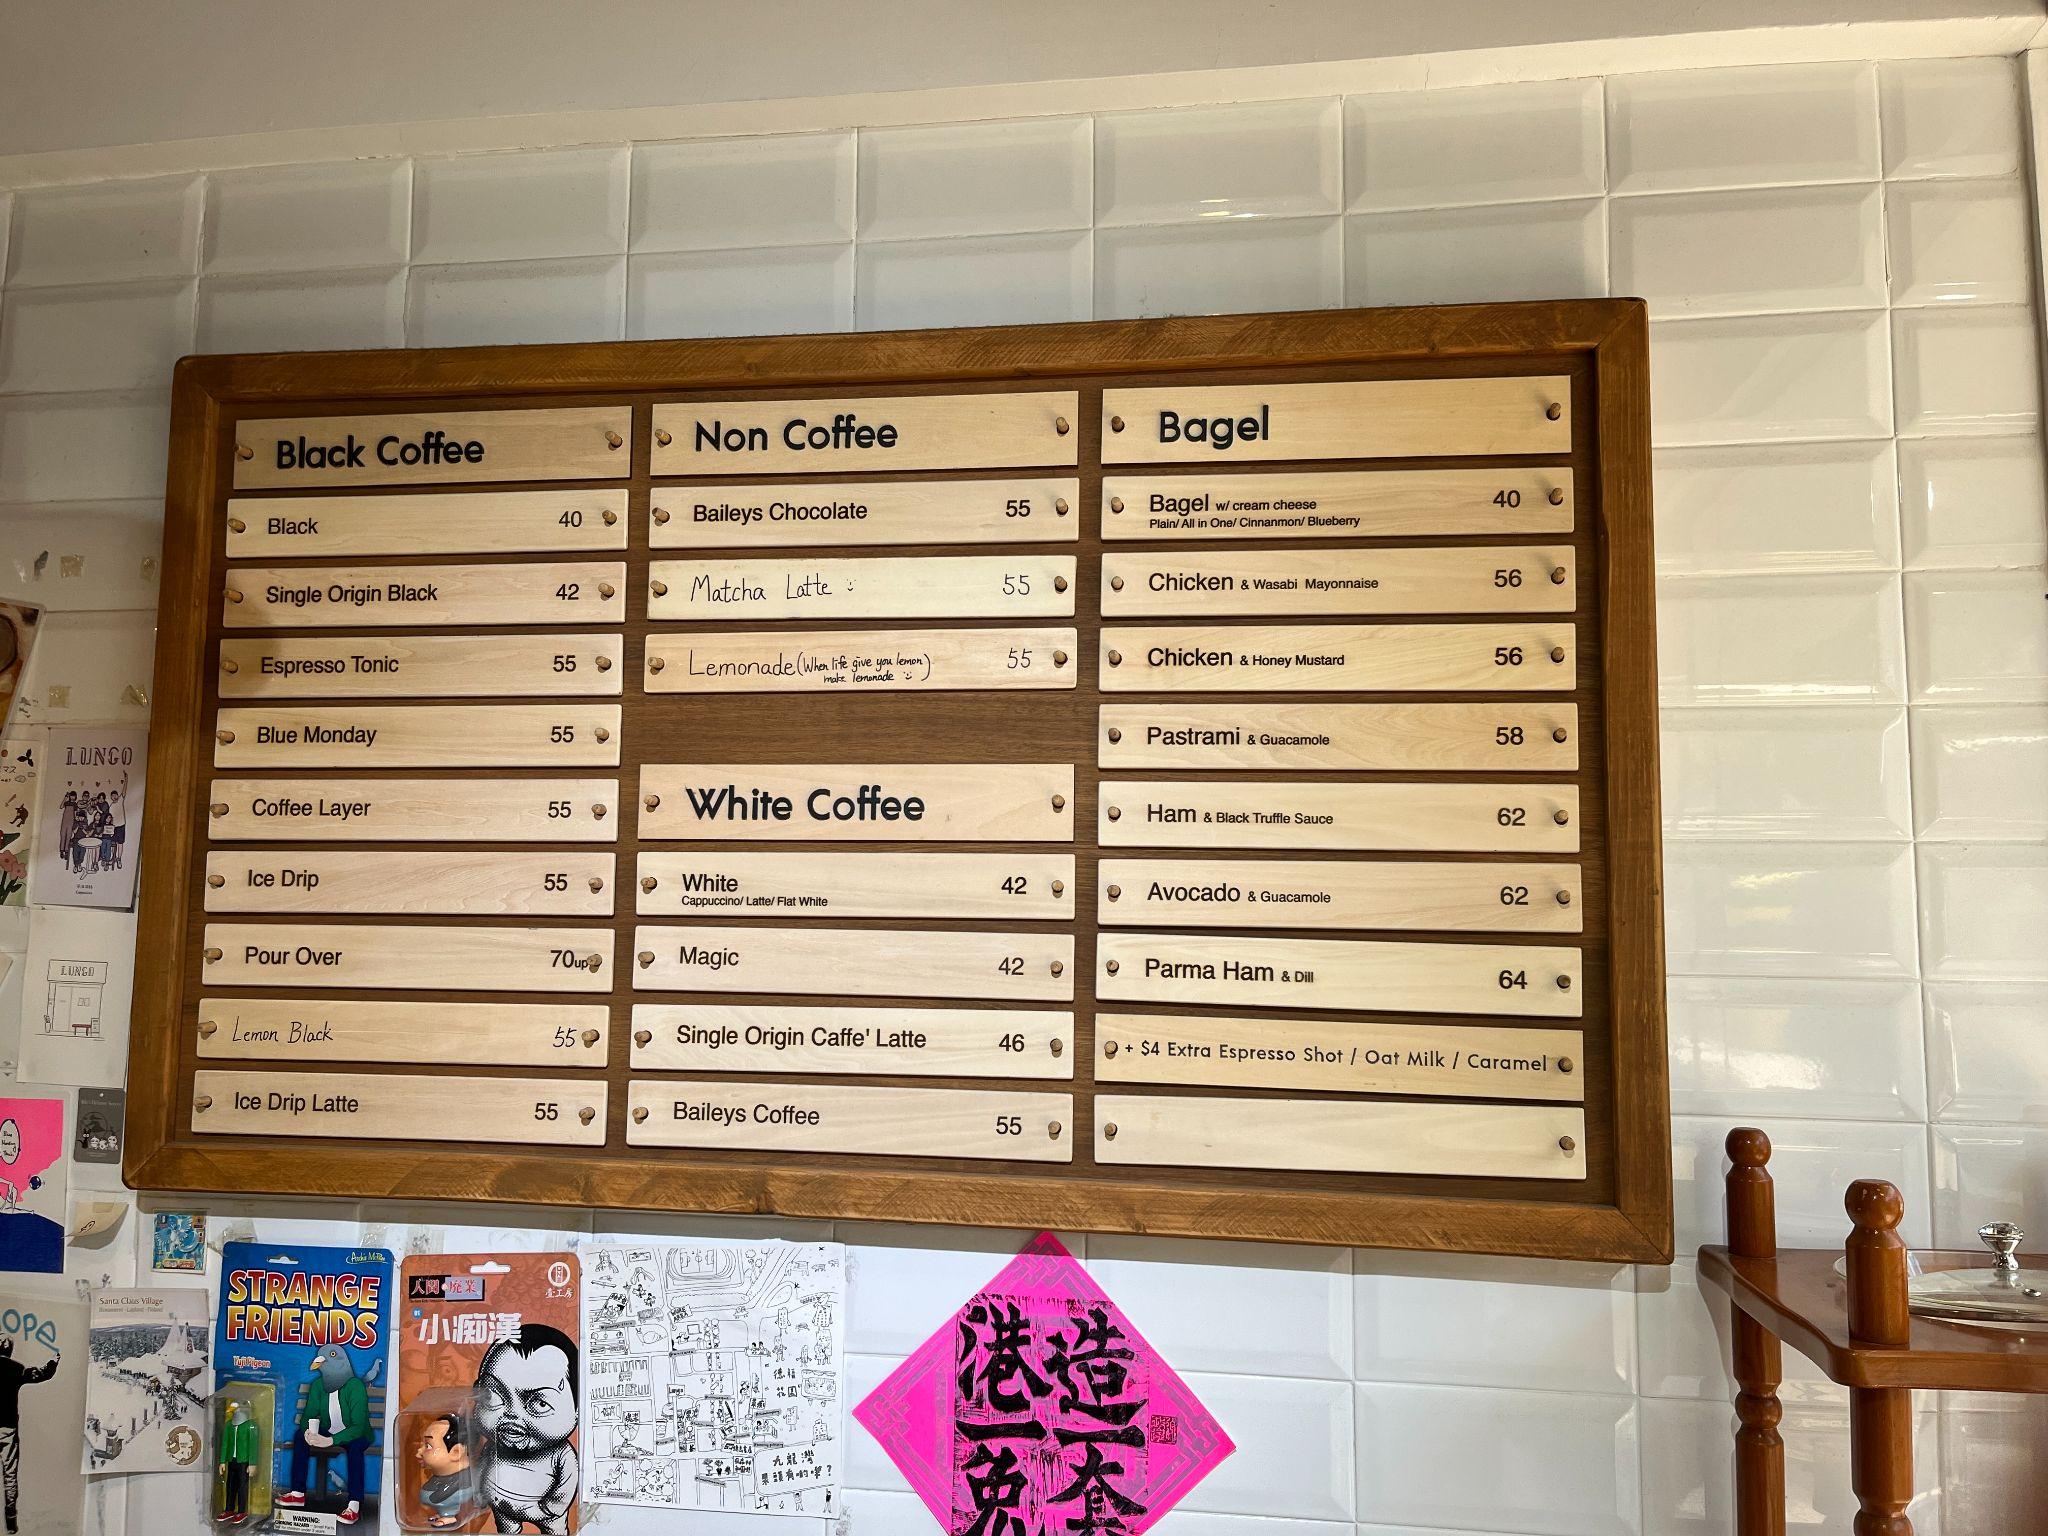 Coffee shop environment and pricing table. This individual worked at a higher-end coffee shop, with a household income of $50,000-100,000. He mentions
“payout” as an aspect he is looking forward to, but worries about having a “sad future” When rating life
satisfaction based on Cantril’s ladder his response was 0/10.
These individuals represent that although higher income may lead to a tendency for a more stable and improved life, many still struggle to find their purpose and make plans for the future.
Individual #3
This individual is a student, age 20, from a household of three (likely single-child) with monthly income between $20,000-30,000. However, income doesn’t affect his ability to be satisfied with life, and although he doesn’t have specific aspects of life he looks forward to or dreads, he rates life satisfaction at 8/10.
Individual #4
Age 25, working at a bakery with a modest monthly household income (household of two, likely a couple) at $20,000-30,000, she rates life satisfaction at 8/10 despite spending 50-60% of household income on private housing and mentioning the difficulty that “working is busy, [there’s] little personal time”. Although she worries that “living is very expensive” she looks forward to “self-support and self-agency” and the “ability to pursue personal interests”.
These individuals show that younger residents without the burden of children and family were relatively more satisfied with their life, implying household responsibility as a factor influencing personal well-being.
Discussion & Conclusion
Data Reliability
With a sample size of 32 and a population size of roughly 60,800 (the population applicable to the survey, which was made to be the working population in TPUs 280 and 291), we found that our sample size gives us a 90% confidence level that real values are within ±14.6% of measured values. (“Sample Size Calculator”). Arguably, our population size could be defined as the number of households in the TPUs (as our questions are primarily focused on encapsulating the well-being of households as represented by individuals), which would decrease the 90% confidence uncertainty interval to approximately ±8.8%.
Although data is affected by uncertainty, the general outcomes from the study will remain similar. We incorporated qualitative information and used secondary sources such as census data and other reports to establish a logical basis for our results.
Future enhancements could be increasing the sample size and performing similar field studies in other regions of Hong Kong to establish the accuracy of correlations and claims made in this report and discover if it applies to the entirety of Hong Kong. It would also be interesting to see the impacts of education attainment on well-being.
It is also noted that there were limitations in 5-year population census data between 1996 and 2021 for the creation of the Lorenz curve for the TPUs 280 and 291, as used in the section “About Kwun Tong”. Notably, TPUs were sometimes grouped (TPUs 280, 286, 291, and 295) and income brackets of households were altered throughout the years. A more accurate version of the Lorenz curve was created for Hong Kong to verify the point.
Housing Inequality Mitigation Efforts
(Kang and Koo) suggest the supply of more affordable housing could help reduce inequality and improve well-being, in line with the plans of the Hong Kong government. The latest “Long Term Housing Strategy” announced by the government places a 70-30 distribution on rental housing and Green Form Subsidized Home Ownership flats (only open to public rental housing residents) to subsidized sale flats. (Hong).
However, some argue there should be a redelegation of the 70-30 balance. Dr. Wendy Hong, a Legislative Council member for the Election Committee constituency, pushes for a 50-50 balance, arguing for more focus on subsidized sale flats. (Hong). Hong believes the maintenance of public rental housing is too costly. Furthermore, the quantity of subsidized sale flats is insufficient for the ‘sandwich class’ (lower middle class without government support in housing), preventing many from achieving better living standards. The lack of incentives to move out of public rental leads to longer wait times.
(Wong, Michael B.) show little to no correlation between macroeconomic factors (credit conditions, economic growth) and housing price index in the past two decades. Instead, Wong argues that unresponsive public rental housing prices impacted the housing crisis.
The cheap and unresponsive public rental prices increased sensitivity of housing demand and supply. In context, slowing housing construction between 2004 and 2020 led to increased housing demand. Unresponsive public rental prices fell below private rental growth, discouraging public rental housing residents from transitioning to private housing. This caused increased competition for limited-supply lower-end private housing, causing its pricing to increase sharply.
Hence, Wong also argues that increasing the public rental housing supply will not solve the affordability issue. Instead, policies could be reoriented towards Subsidized Home Ownership and subsidized sale flats, allowing lower-income households to become homeowners. This would increase the supply of available affordable housing on the market and reduce lower-end private housing price sensitivity.
Professor Y. C. Richard Wong also supports the perspectives of (Wong, Michael B.) and (Hong). In his book “Fixing Inequality in Hong Kong”, Wong highlights that restrictions on public housing are limiting the acquisition and accumulation of property wealth for low-income households. By privatizing and supporting home ownership amongst low-income households, more land value could be unlocked, reducing the housing pricing speculation that is hiking up the prices. (Wong, Yue Chim Richard).
Conclusion
Individual well-being, trust and cooperation, and life satisfaction were at or below average, and there were lower levels of community interaction and perception of the effectiveness of government housing policies.
Furthermore, housing characteristics such as size, cost, and value had noticeable correlations with the perceived well-being of individuals. In terms of community well-being, housing type was found to have noticeable effects on the number of close friends/relationships and the daily interaction experience of participants.
Hence, it is concluded that income and housing inequality have noticeable impacts on the well-being of individuals and communities, with increasing inequality leading to reduced well-being.
Policies could focus on encouraging low-income households to become homeowners, e.g., through subsidized sale flats, and additional support could be placed on the nurturing of social capital and community support in Hong Kong.
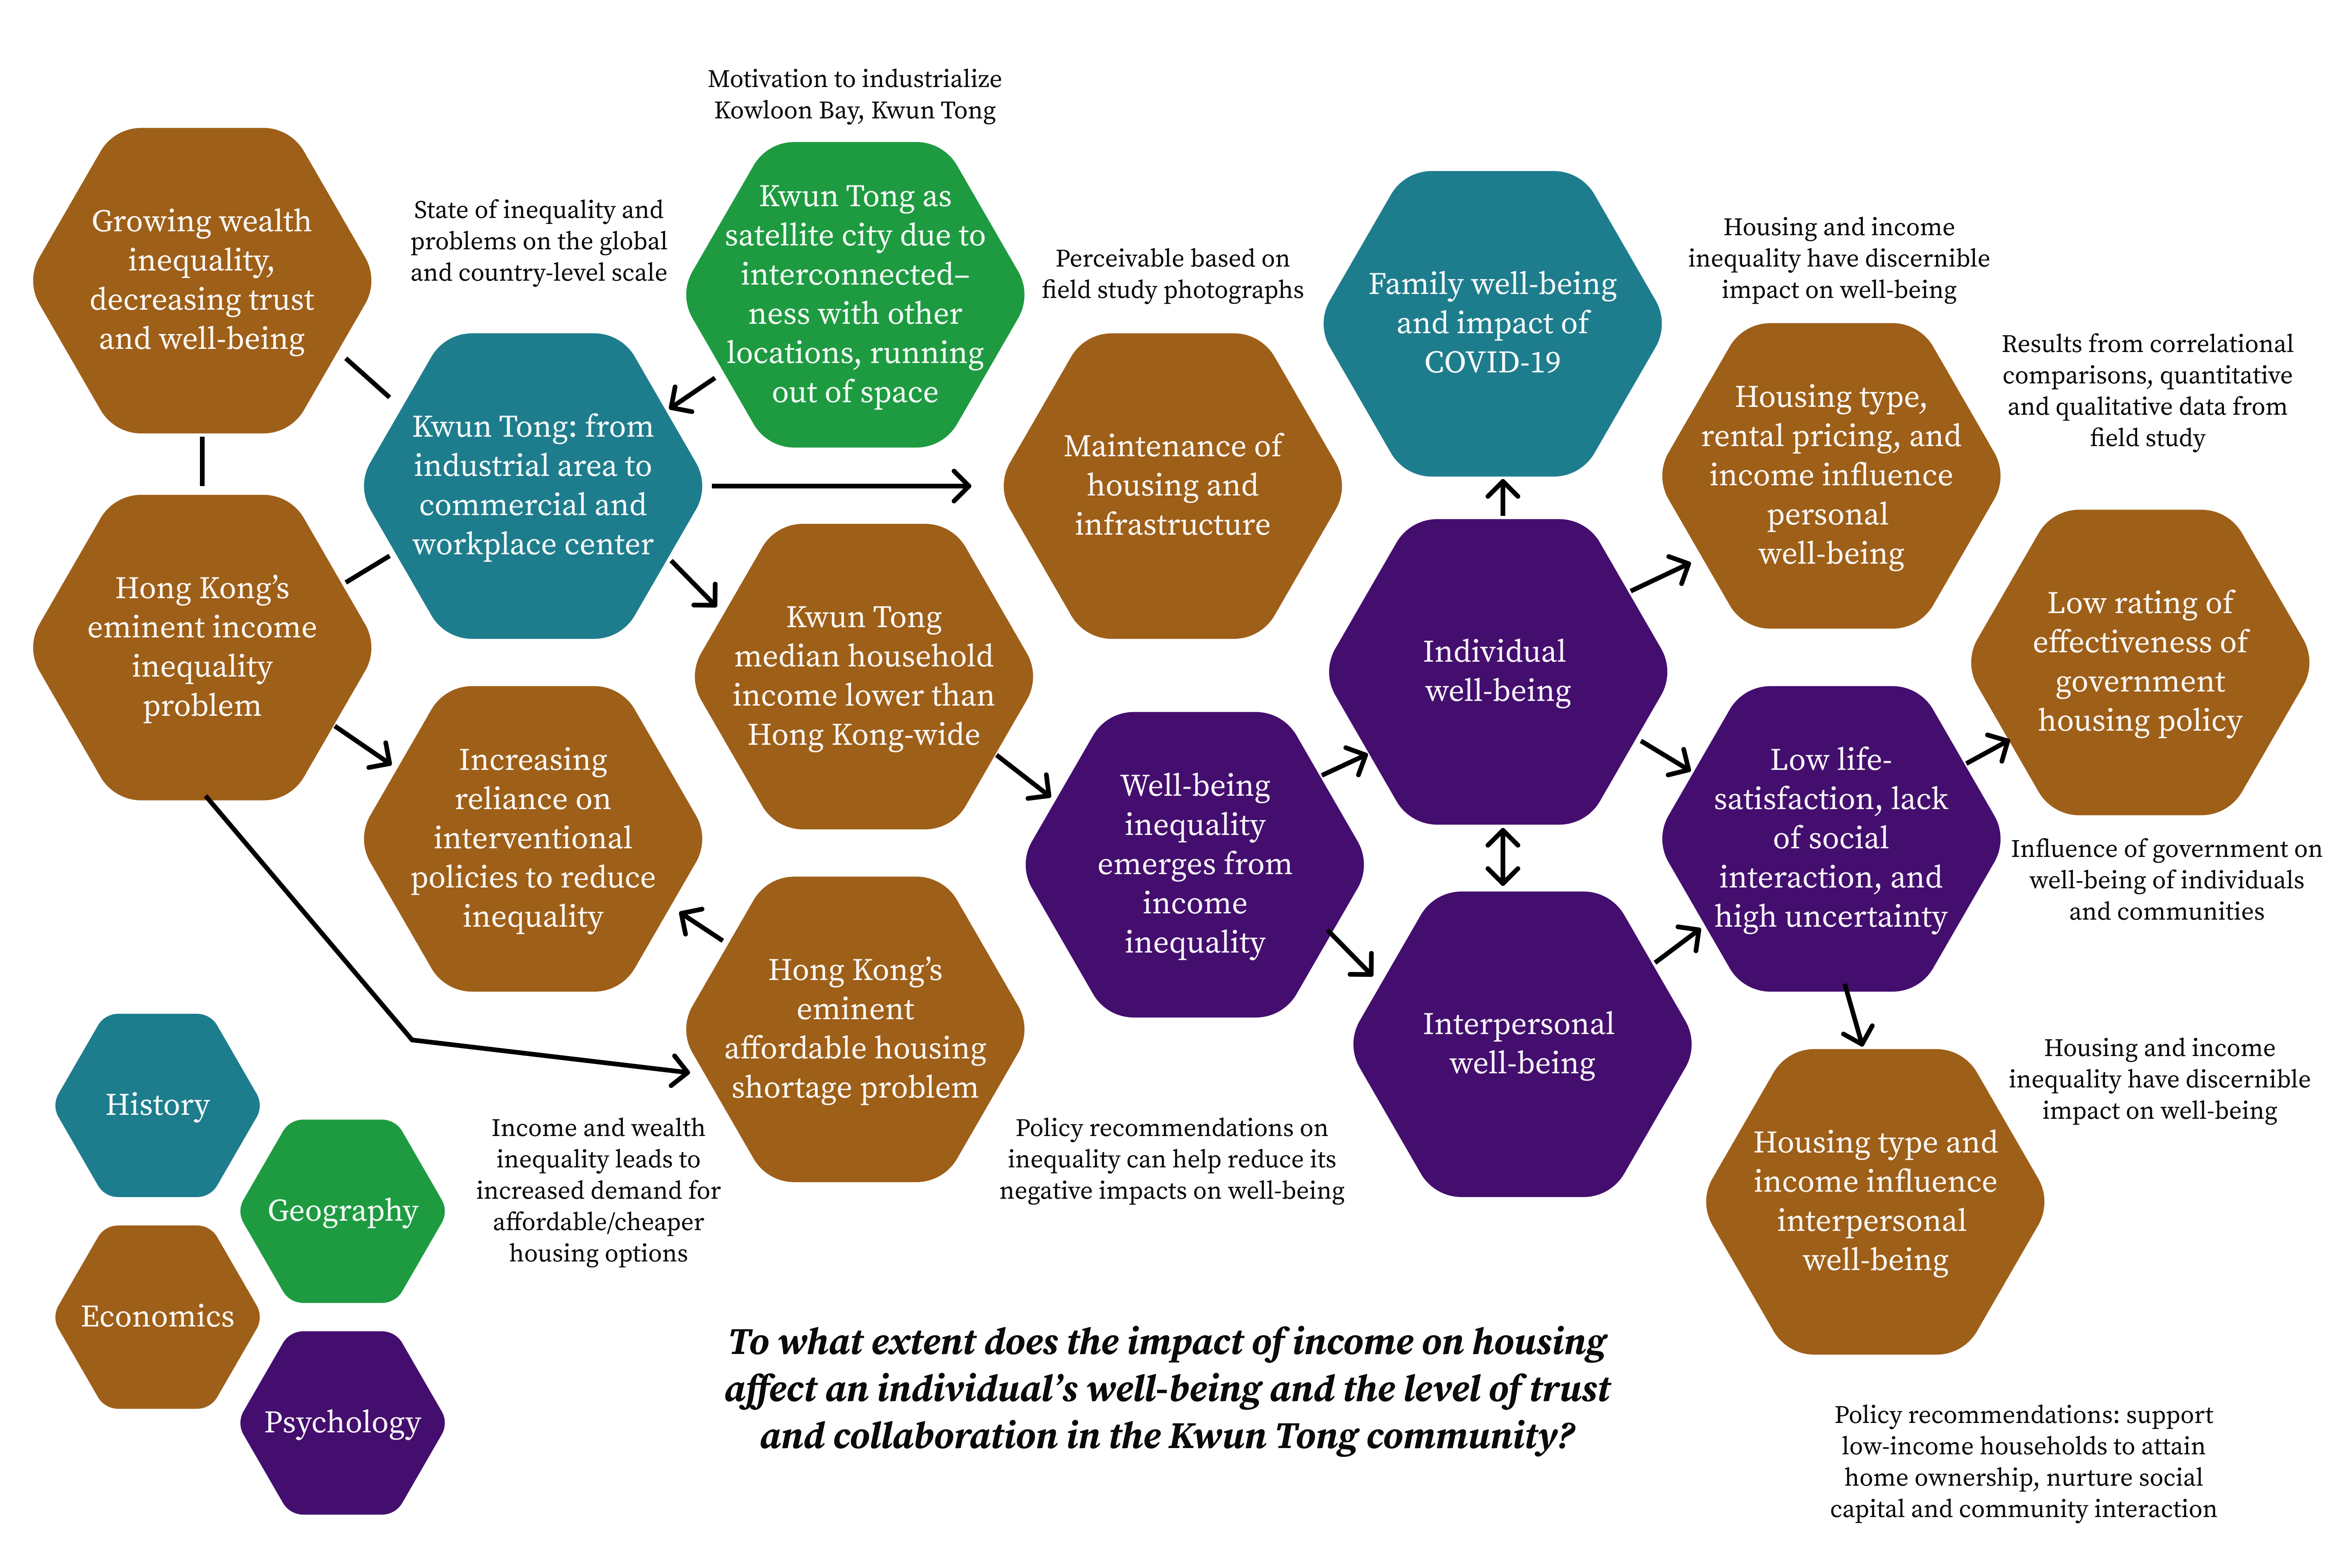
Hexagon Map
Appendix & Bibliography
Appendix
Appendix A: subdivided flats in Kwun Tong
Data from 2018 indicate over 11,000 people lived in subdivided flats in Kwun Tong, with numbers expected to increase. These flats had a median floor area of 3.7m², and were characterized as expensive, particularly for workers with unstable or low income. For many, median rent of $5,700 accounted for more than half their income, above the 30% threshold for affordable housing set by the United Nations. (Lai et al.). (Lai et al.) describe that maintenance and repair of these units were poor, and basic resources such as water and electricity were overpriced. They make recommendations for the enforcement of maintenance responsibility in contracts, and the controlling rent, rent growth, and cost of water/electricity.
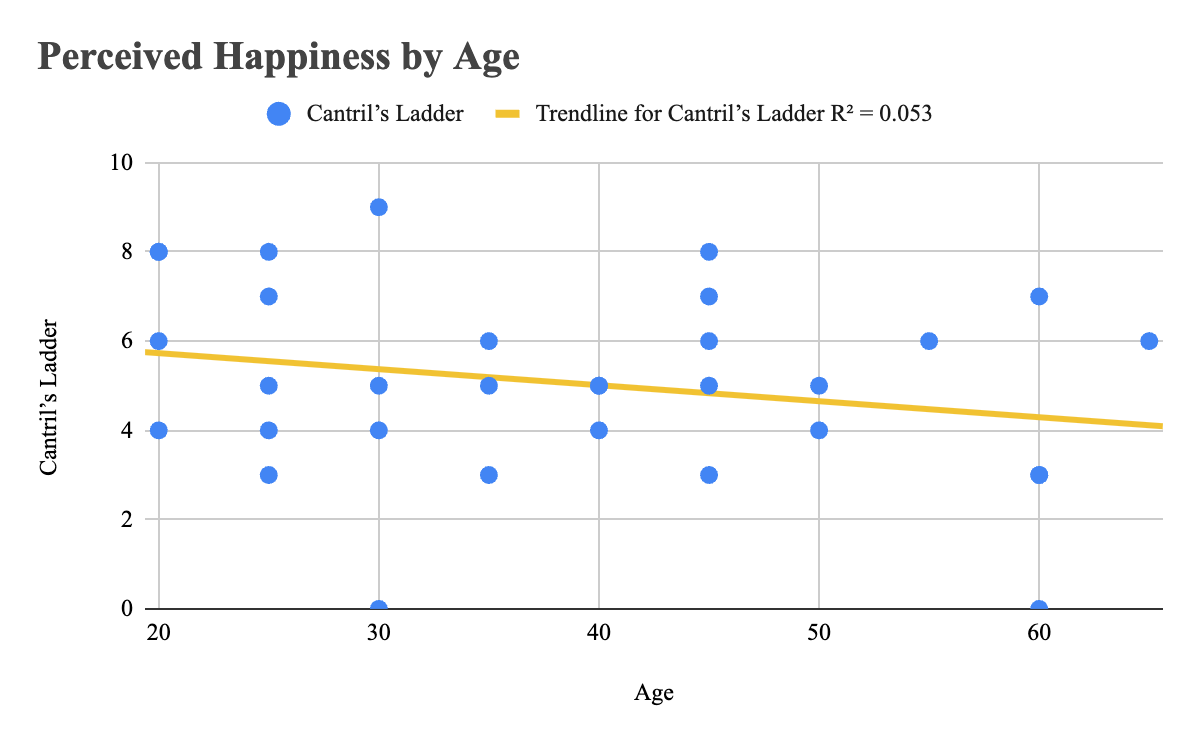
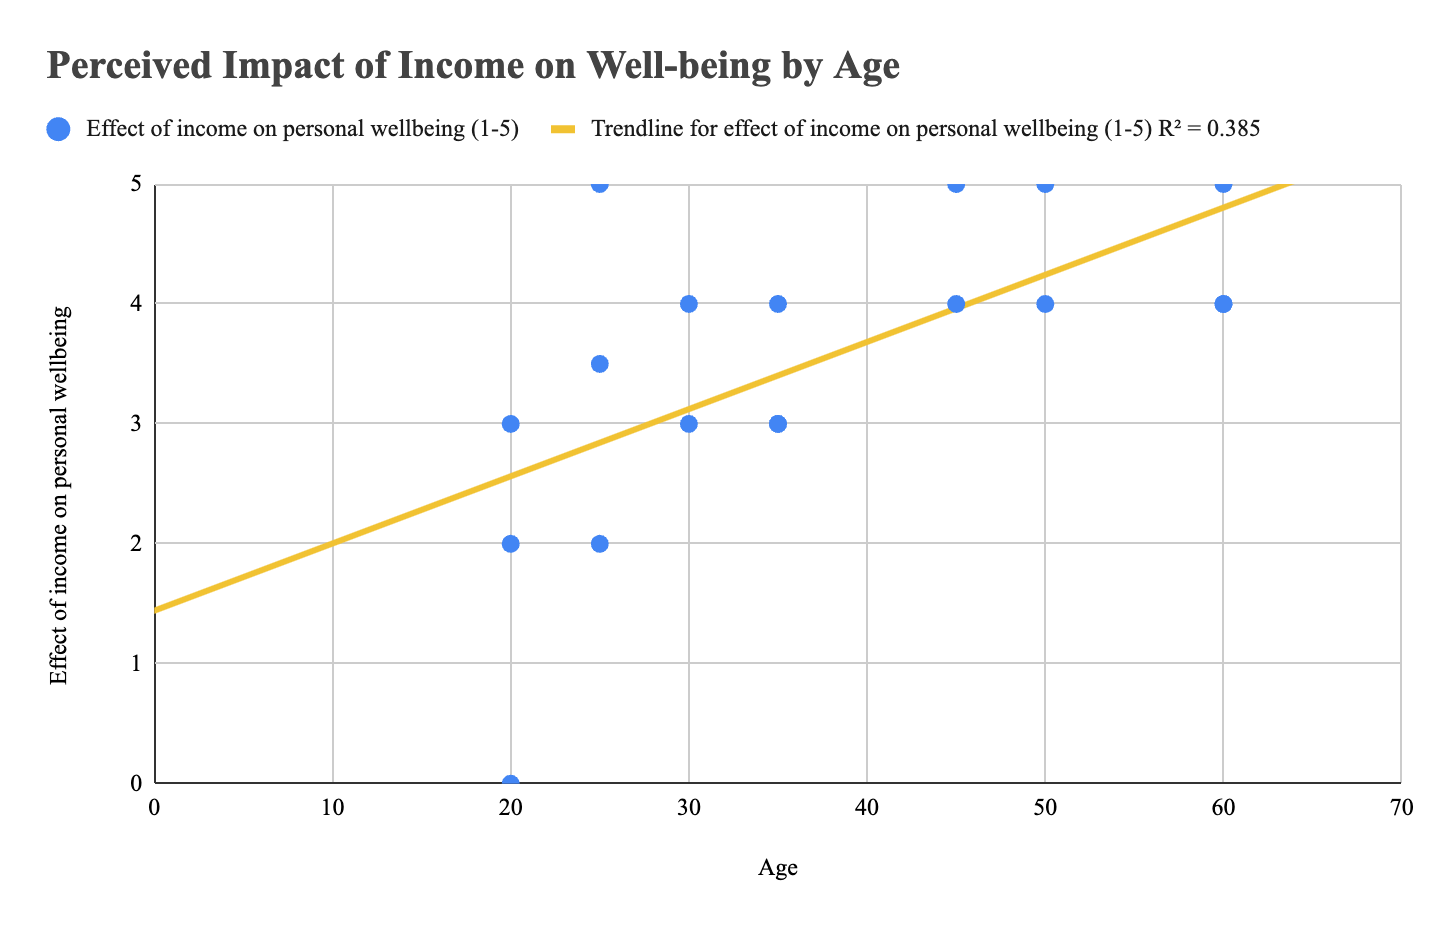
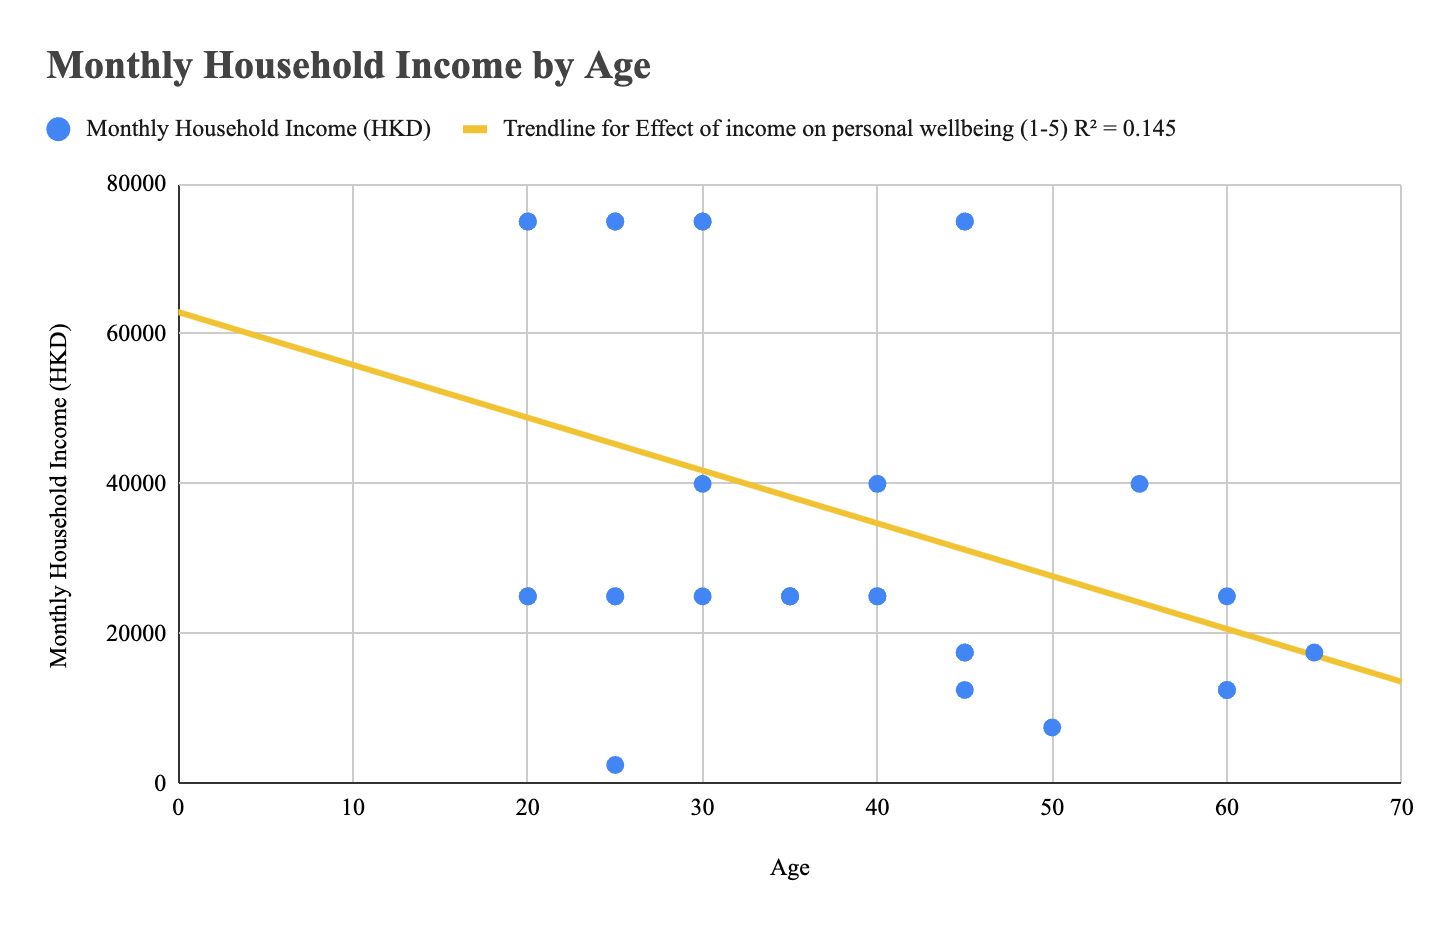
Appendix B: Impact of age on individual well-being and economic/housing characteristics
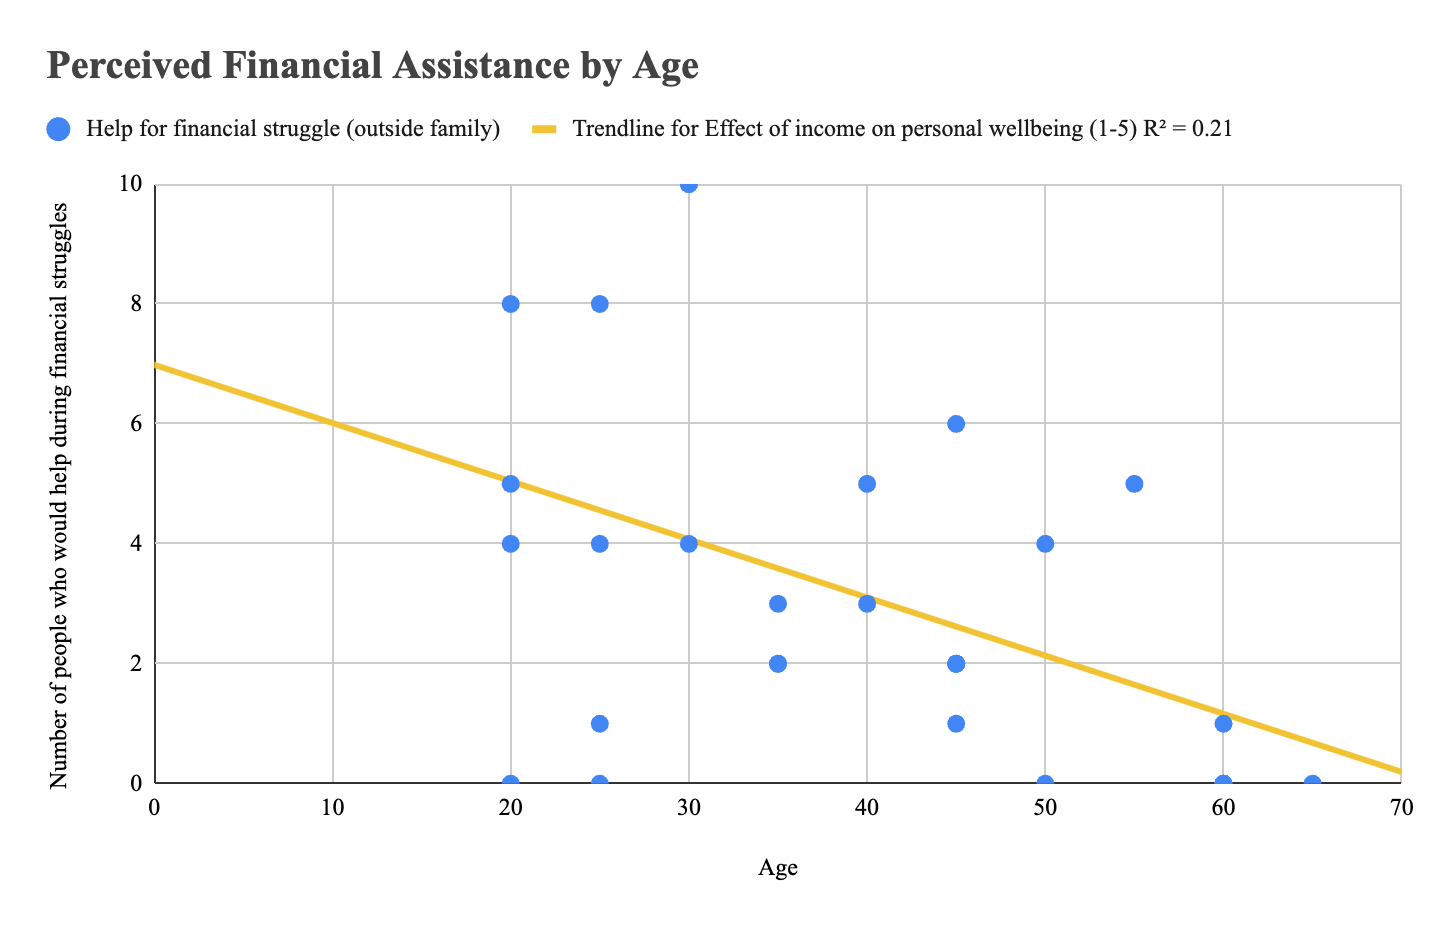
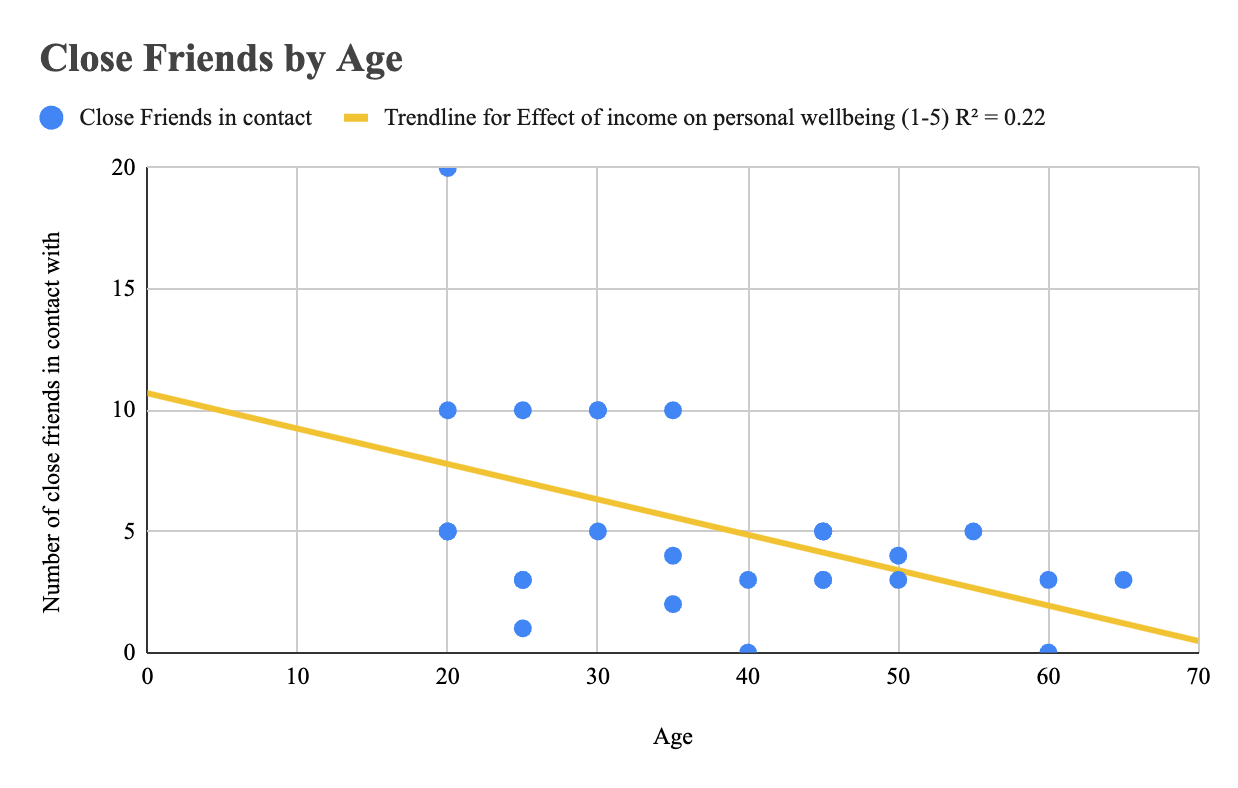
Appendix C: Proportion of participants above 30% United Nations Affordable Housing Rental Benchmark
9 out of 32 participants (28%) spent above 30% of their monthly household income on housing. This highlights the affordable housing problem in the study region (and in Hong Kong).
Appendix D: Estimated survey attempts during field study
We estimate asking ~80 participants over the two days, obtaining 32 responses. Data was gathered from various locations throughout the study site and covered a variety of demographics (e.g., age, financial status, household and housing characteristics).
Appendix E: History of social capital in Hong Kong — the transition between colonial and post-handover Hong Kong
“Hong Kong seems to be rather lacking in the reserves of social capital found in some other parts of the developed world… In fact, Hong Kong looks a little like those parts of Italy or Russia where social capital has never really developed”
- During the rule of the colonial government, welfare and community building were practically non-existent, a phenomenon that was sustained even after the handover in 1997.
- At first, community participation in government matters was not considered. “In a way, the government and the people tried to keep their distance from each other. In a sense, the social capital or mutual trust between the people and the government during the early colonial rule was low.” (Ng)
- However, riots in 1966 and 1967 led to improvements in communication between government and population. In 1970s, commitments were made to improve the social welfare system, and there were more efforts into subsidizing education (basic free education), public health care services, and public housing development.
“Community center facilities were established in public housing estates in the early 1960s and expanded in the 1970s to encourage the ‘amalgamation of divergent groups and the formation of more coherent communities, fulfilling the quasi-political function of integrating migrants from China into the Hong Kong society, inducing a sense of community and maintaining social stability’
(Director of Social Welfare, 1967).”
Appendix F: Key takeaways
Kwun Tong was historically the industrial center of Hong Kong and the first satellite city of Hong Kong, however as manufacturing moved north towards mainland China, the region lost its former bustle and activity. The government currently aims to revitalize the region to support developments in Kowloon East and develop a commercial and workplace center.
This report found a variety of insights important to the study of the state of housing and economic inequality in Hong Kong, with its relation to individual and interpersonal well-being, particularly in the Tertiary Planning Units 280 and 291 (Kowloon Bay Industrial Area and surrounding housing). Particularly:
- Income inequality pre-redistribution is increasing, but income inequality post-redistribution is decreasing. This highlights widening inequality and increasing reliance on interventional policies to reduce inequality.
- Well-being deteriorated over COVID-19 as measured by mental well-being and family well-being. More vulnerable groups were impacted disproportionately, widening the well-being inequality gap between low- and high-income households.
- Households in private housing had noticeably larger homes, household size, and income, and housing size tended to decrease with construction year. This likely indicates attempts to keep housing affordable (given the rising land prices) by increasing the concentration of units per area.
- Housing was well-maintained, with newer public housing estates being especially well-maintained. Infrastructure maintenance left much to be desired but preserved a remnant and reminiscent view of Kwun Tong’s history.
The field study gave additional insights:
- Life satisfaction is below the global average of 5.5/10, at 5.06/10. Most participants didn’t know what they dreaded or hoped for. Of those sure, income, economy, and work-life balance were essential components that dictated their outlook on life.
- Participation in community activities on the District-wide and Neighborhood-wide scale was extremely low, with most respondents never having participated in such activities. Furthermore, perceived trust within Kwun Tong averaged 2.97/5, and trust within the neighborhood averaged 3.37/5. Notably, we found the average number of neighbors trusted in extreme cases was 0.31, indicating that citizens didn’t trust anyone other than immediate family for help during dire situations.
- People tended to be happier in private and subsidized home ownership public housing compared to public rental housing, suggesting that housing characteristics (e.g., monetary value and size) impact personal well-being. Residents who can afford more expensive housing attribute happiness to factors outside of housing, whereas residents who lived in cheap housing found that their living situation significantly impacted their well-being.
- Residents under the Subsidized Home Ownership Scheme (HOS) had the most favorable views on the effectivity of government housing policies, but it is notable that on average, participants rated government housing policy effectivity at 1.6/5, highlighting the need for more effective measures to be taken.
Appendix G: Efforts in social capital
The Community Investment and Inclusion Fund (CIIF) is a policy established in 2002 that aimed to improve social capital in Hong Kong.
“…social capital was a new thinking in welfare policy […] The cost-effectiveness of social capital far exceeds that of direct financial aid. The problem of poverty gap and cross-generation poverty cannot be solved by money alone, not to mention that care and concern are invaluable. As public resources are limited, we have to help people to help themselves and foster mutual aid and co-operation to achieve an all-win situation”
(Ng) remarks that social capital is beneficial in shifting “people’s mentality from welfare dependency to self-reliance”, helping enhance individuals’ self-agency and create a sense of communal inclusion and solidarity. The benefits of social capital towards reducing inequality and enhancing well-being indicate that additional efforts could be placed to nurturing and growing social capital in Hong Kong.
Appendix H: Further notes
“…although the perceived level of household income inequality is decreasing, it is primarily due to redistribution policies. Without intervention, income inequality is growing. […] This is a problem as increasing income inequality requires more government intervention and measures to be reduced, highlighting the increasing inequality in Hong Kong society.”
It is important to mention that in any society, even providing absolute equality (e.g., in a hypothetical scenario, resetting access to opportunities for everyone in an instant) will not be sufficient to sustain equality. For The Pudding, data journalist Alvin Chang explored the concept of the Yard-sale model, which establishes that having equal opportunities and exchanges will by chance be more beneficial to a select few than to others, leading to an accumulation of resources and wealth in a minority.
“…it can be useful as a way to think about the general ‘trickle-up’ characteristics of a free market. It’s contrary to what many conservative politicians have argued for decades – that wealth trickles downward. They’ve said the government should just get out of the way to let the wealthy create jobs for the rest of us. This ideology has led to massive tax cuts for the rich, from Ronald Reagan’s tax cut in 1981 to Donald Trump’s 2017 tax cut.”
Wealth redistribution policies such as taxation and welfare can help reduce such inequalities, albeit requiring sustenance and continuity. However, redistribution cannot inherently resolve the origin of inequality.
“Giving money to the poor only addresses the problem of low levels of consumption among low-income households, but it does not change the fact that they have low incomes.”
Bibliography
2006 Population By-census Office Census and Statistics Department. Thematic Report: Household Income Distribution in Hong Kong. Census and Statistics Department. Census and Statistics Department, www.censtatd.gov.hk/en/data/stat_report/product/B1120045/att/B11200452006XXXXB0400.pdf. Accessed 26 Mar. 2024.
2021 Population Census Office Census and Statistics Department. Thematic Report: Household Income Distribution in Hong Kong. Census and Statistics Department. Census and Statistics Department, www.censtatd.gov.hk/en/data/stat_report/product/B1120108/att/B11201082021XXXXB0100.pdf. Accessed 26 Mar. 2024.
Arranz, Adolfo, et al. “Life in Hong Kong’s shoebox housing.” South China Morning Post, 7 June 2022, multimedia.scmp.com/infographics/news/hong-kong/article/3180601/subdivided-flats/index.html. Accessed 14 Mar. 2024.
Blue Lapis Road. “THE BEAUTY OF CONTRADICTIONS, Kowloon Bay (九龍灣), Kowloon, Hong Kong.” Blue Lapis Road, 19 Nov. 2022, bluelapisroad.wordpress.com/2022/11/19/the-beauty-of-contradictions-kowloon-bay-%E4%B9%9D%E9%BE%8D%E7%81%A3-kowloon-hong-kong/. Accessed 25 Mar. 2024.
Census and Statistics Department. “Statistics - By Subject.” Census and Statistics Department, The Government of the Hong Kong Special Administrative Region, www.censtatd.gov.hk/en/page_8000.html. Accessed 26 Mar. 2024.
Centaline Property. “Amoy Gardens.” Centaline Property, hk.centanet.com/estate/en/Amoy%20Gardens/3-EWKSBPYOPS. Accessed 15 Mar. 2024.
Chan, Wah. 九龍灣1981年. 16 July 2016. Flickr, www.flickr.com/photos/wahchan/28302771606/. Accessed 25 Mar. 2024.
—. 九龍灣站@1970’s. 11 Jan. 2024. Flickr, www.flickr.com/photos/wahchan/53456692348/. Accessed 25 Mar. 2024.
—. 九龍灣觀塘道(九龍灣站)1978年. 1 Dec. 2013. Flickr, www.flickr.com/photos/wahchan/11150284966/. Accessed 25 Mar. 2024.
Chang, Alvin. “Why the Super Rich Are Inevitable.” The Pudding, Jan. 2023, pudding.cool/2022/12/yard-sale/. Accessed 9 Apr. 2024.
Dai, Tiantian, et al. “Inequality and Social Capital: How Inequality in China’s Housing Assets Affects People’s Trust.” Emerging Markets Finance and Trade, vol. 56, no. 3, 9 Oct. 2018, pp. 562-75, https://doi.org/10.1080/1540496x.2018.1516637.
DC Chan. On Tat Estate. Google Maps, Apr. 2022, maps.app.goo.gl/u6qsPN7QqkdxuV8r7. Accessed 15 Mar. 2024.
Demery, Leroy W., Jr. Kowloon Bay - 3 (Hong Kong, 1980). 30 Sept. 2010. Flickr, www.flickr.com/photos/lwdemery/5037791221/. Accessed 25 Mar. 2024.
“Double Cove Phase 5 (Double Cove Summit) Block 11 Middle Floor Flat A.” Midland Reality, 5 Mar. 2024, www.midland.com.hk/en/property/New-Territories-Wu-Kai-Sha-Double-Cove-Phase-5-Double-Cove-Summit-Block-11-Middle-Floor-Flat-A-M351248369. Accessed 15 Mar. 2024.
Esrichinahk. “Tertiary Planning Unit in Hong Kong.” 22 Aug. 2022. ArcGIS, services3.arcgis.com/6j1KwZfY2fZrfNMR/arcgis/rest/services/Tertiary_Planning_Unit_in_Hong_Kong/FeatureServer. Accessed 16 Mar. 2024. Data set.
Grootaert, Christiaan. Measuring Social Capital: An Integrated Questionnaire. World Bank, Nov. 2003, documents1.worldbank.org/curated/en/515261468740392133/pdf/281100PAPER0Measuring0social0capital.pdf. Accessed 14 Mar. 2024.
Hong, Wendy. “Tackle Hong Kong’s shortage of affordable housing with more subsidised sale flats.” South China Morning Post, 9 Nov. 2023, www.scmp.com/comment/opinion/article/3240652/tackle-hong-kongs-shortage-affordable-housing-more-subsidised-sale-flats. Accessed 14 Mar. 2024.
Hong Kong Family Welfare Society, and Hong Kong Public Opinion Research Institute. Hong Kong Family Wellbeing Index 2022. Hong Kong, Hong Kong Family Welfare Society, 19 May 2022. Hong Kong Family Welfare Society, www.hkfws.org.hk/assets/files/hkfwi/hkfws-hkfwi-booklet-20220715-web.pdf. Accessed 14 Mar. 2024.
Hung, Maria. “Impact of COVID-19 Pandemic on Hong Kong General Population’s Mental Health.” Hong Kong Journal of Mental Health, 2022. The Mental Health Association of Hong Kong, www.mhahk.org.hk/Chi/pdf/Journal/Vol47&48No1/2021&2022-47&48-1-37-41.pdf. Accessed 14 Mar. 2024.
Kang, Sungik, and Ja-Hoon Koo. “Exploring Social Capital Level in Regions with Large and Increasing Wealth Inequality: Lesson from Seoul, South Korea.” Social Indicators Research, vol. 168, nos. 1-3, 22 May 2023, pp. 165-83, https://doi.org/10.1007/s11205-023-03128-3. Accessed 14 Mar. 2024.
Kwun Tong District Council. “History.” Fun in Kwun Tong, Kwun Tong District Council, 2022, www.kwuntong.org.hk/en/history.html. Accessed 14 Mar. 2024.
Lai, Kin Kwok, et al. Research Programme on Sub-divided Units in Kwun Tong District. Hong Kong, Caritas Institute of Higher Education, June 2021. Fun in Kwun Tong, www.kwuntong.org.hk/publications/Sub-divided_Units_Kwun_Tong_Report.pdf. Accessed 14 Mar. 2024.
“Luxury Apartments in Hong Kong: Your Complete Guide to Finding the Perfect Home.” The Editors Company, 17 Apr. 2023, www.editorscompany.com/post/luxury-apartments-in-hong-kong-your-complete-guide-to-finding-the-perfect-home. Accessed 18 Mar. 2024.
Ng, Sik-Hung. Social Capital in Hong Kong: Connectivities and Social Enterprise. Accessed 14 Mar. 2024.
Population Census. “District Profiles.” 2021 Population Census, Hong Kong Government, 2021, www.census2021.gov.hk/en/district_profiles.html. Accessed 15 Mar. 2024.
“Sample Size Calculator.” Calculator.net, Maple Tech, www.calculator.net/sample-size-calculator.html. Accessed 15 Mar. 2024.
Wong, Michael B. “What Caused Hong Kong’s Housing Crisis?” Michael B. Wong, 23 Sept. 2022, mbwong.com/pdf/Housing_Crisis.pdf. Accessed 14 Mar. 2024.
Wong, Yue Chim Richard. Fixing Inequality in Hong Kong. Hong Kong UP, 2017. JSTOR, https://doi.org/10.2307/j.ctt1rfzz9q. Accessed 14 Mar. 2024.
“World Happiness Report Data Dashboard.” World Happiness Report, worldhappiness.report/data/. Accessed 30 Mar. 2024.
Wpcpey. Kowloon Bay. Dec. 2018. Wikimedia Commons, commons.wikimedia.org/wiki/File:Kowloon_Bay_View_201812.jpg. Accessed 25 Mar. 2024.
兄弟中港. Kingston International Centre. Mar. 2019. Google Maps, maps.app.goo.gl/UEscHbMxHDrM7Q9eA. Accessed 1 Apr. 2024.
觀塘工業區的活化和發展研究. Kwun Tong District Council. Fun in Kwun Tong, www.kwuntong.org.hk/publications/RD_KT_Ind_District_Study.pdf. Accessed 14 Mar. 2024.
Acknowledgements
The field study was conducted with the support of other peers.
This article was adapted for online reading with a modified version of Tufte CSS.